How To Create A Harvey Balls PowerPoint Presentation?
Adding quantitative data to your presentations, such as numbers, metrics, and stats, is easy. But How do you represent data focused on understanding the underlying reasons, motivations, and nuances behind your business? How do you explain the quality or safety of your products? Worry not; we have a solution for you- Harvey Balls PowerPoint.
This blog will help you learn how to create Harvey Balls PowerPoint presentations. The examples and templates at the end of this blog will give you a clear understanding of the concept.
What Are Harvey Balls?
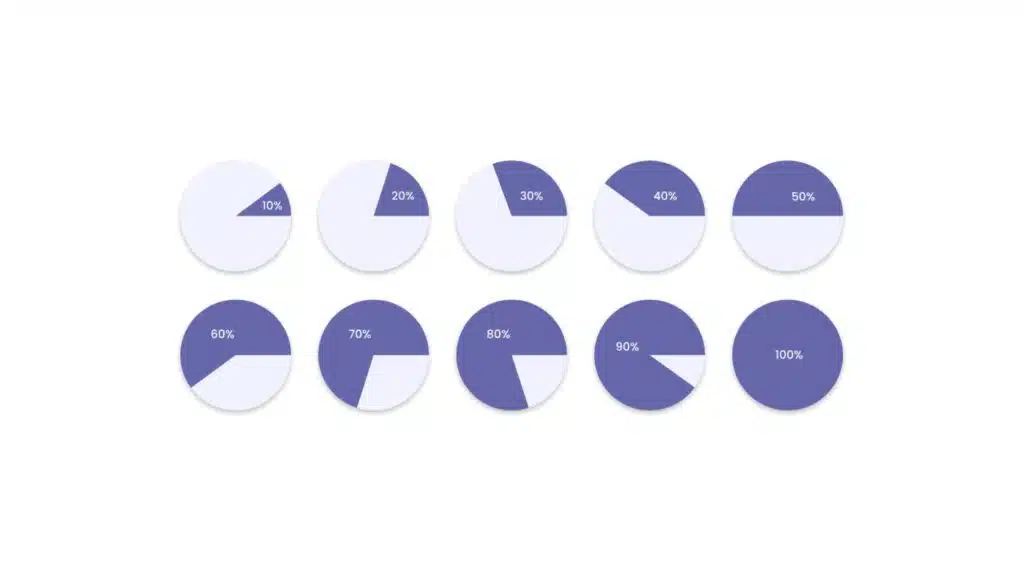
Harvey Balls are a graphical system representing qualitative information or ratings within documents, reports, or presentations. It is a series of circles, most commonly filled with different shading or colors. It represents graphical form completion, satisfaction, importance, or any other fillable qualitative attribute.
They are very adjustable; even one can change their size at a minor point for a different shade of the balls or change their size to produce the needed effect. Usually, a filled circle represents a high level, i.e., full completion or maximum satisfaction. In contrast, an empty circle represents a low level, i.e., incomplete or unsatisfactory.
You might find this visual tool in several comparison types, such as comparing a product by price, weight, quality, taste, safety, etc. Now, you have understood what are harvey balls. Let’s Discuss its advantages now.
Advantages Of Using Harvey Balls PowerPoint Presentation
You learned about what is a Harvey Ball. Let’s discuss its advantages now. They have many advantages in PowerPoint presentations and other documents. Let’s look at some of the pros mentioned below:
- Save Space On A Slide: Instead of using large data tables, you can use these balls to shrink that information. For instance, if you want to compare two things regarding safety, quality, or market share, you can use them for a quick visual depiction.
- Visualizes Qualitative Data: It can be an excellent visual tool for depicting qualitative information. It imparts greater clarity and helps improve understanding of very complex sets of information with the help of symbols instead of text or numbers, which could have impaired clarity and added to the cognitive load.
- Efficiency: They efficiently communicate relative levels or comparisons. They save time compared to reading detailed reports or analyzing sets of numbers since they summarize the information to be presented into a more easily perused display that may help them find trends, patterns, or outliers.
- Enhances Engagement: The graphical representation of the percentages could elicit more interaction and help the audiences stay with the information better than plain text or numerical data, which they can find less visually exciting and inspiring for the eye of the reader to interact with the information presented, therefore making it a possibility for better understanding and information retention.
- Flexibility: They are very flexible and can take any form, given needs or preferences. It means that they can vary in size, color, and even shading to bring out different meanings or accommodate various levels of data granularity.
When to use Harvey Balls PowerPoint Presentation?
We have discussed what is a harvey ball. As discussed above, professionals can use Harvey ball icons for different purposes. Business professionals must do qualitative comparisons and analyses of various reports. We can use PowerPoint Harvey Balls for the following:
To Showcase The Project Status
A simple, quick, and everyday use of the Harvey Balls PowerPoint is to convey project status. You can use Multiple balls to show the status of different aspects of a project, such as milestones, budget expenditures, etc.
Here are a few Harvey Balls Examples to effectively showcase the project status report –
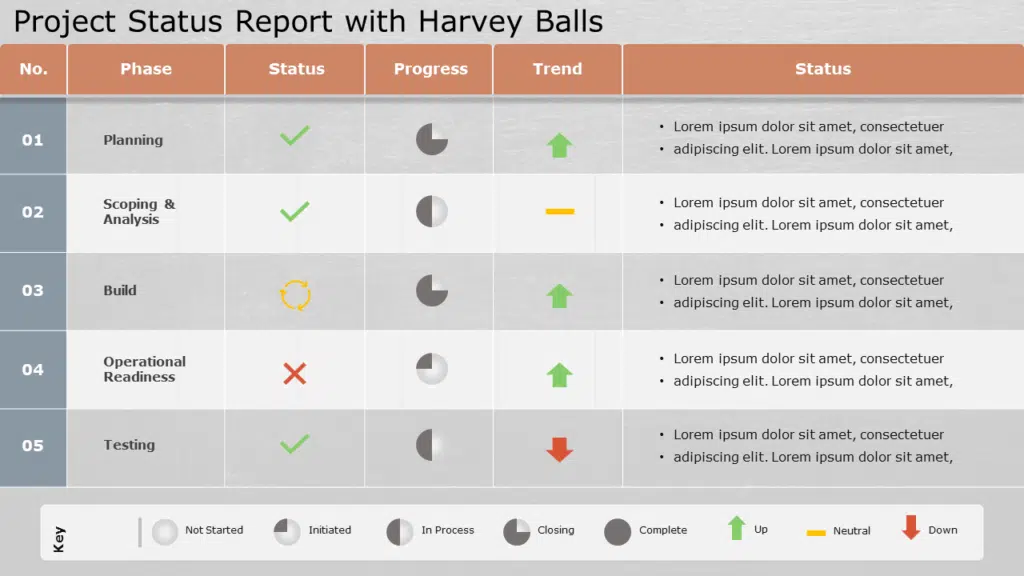
The above project status PowerPoint template shows how you can use it to showcase the status of various aspects of your project, such as planning, development, testing, etc. This compelling visual tool can help you quickly overview your project.
To Compare Products
Harvey Ball chart compares a particular product or process to assess differences between their characteristics or features. While comparing products is often straightforward (price, weight, features), Harvey balls PowerPoint is handy for comparing more qualitative information, such as taste or quality, features, usability, and affordability.
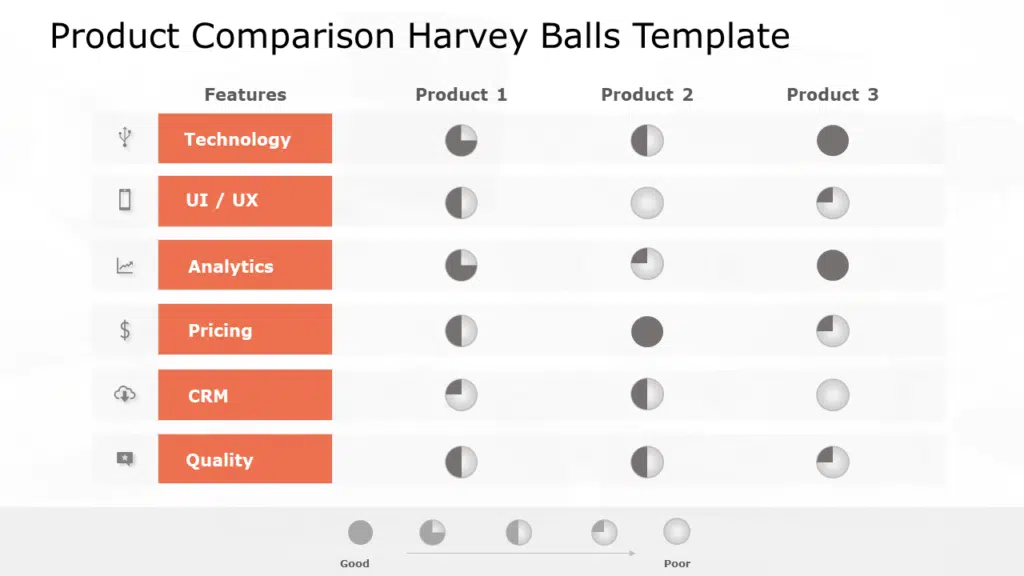
As you can see in the above template, PowerPoint Harvey Balls can be utilized to compare multiple products by listing down the criteria of your decision, such as price, UX, quality, etc. You can change the colors of the balls and the shaded portions in the balls.
For Human Resources And Management
Rating and ranking employees is a challenge for human resource professionals and managers. These balls are an easy, unbiased way to evaluate employees. Most managers aren’t ranking their employees solely on performance. Often, there are other characteristics a manager looks for, such as potential, work ethic, teamwork, etc.
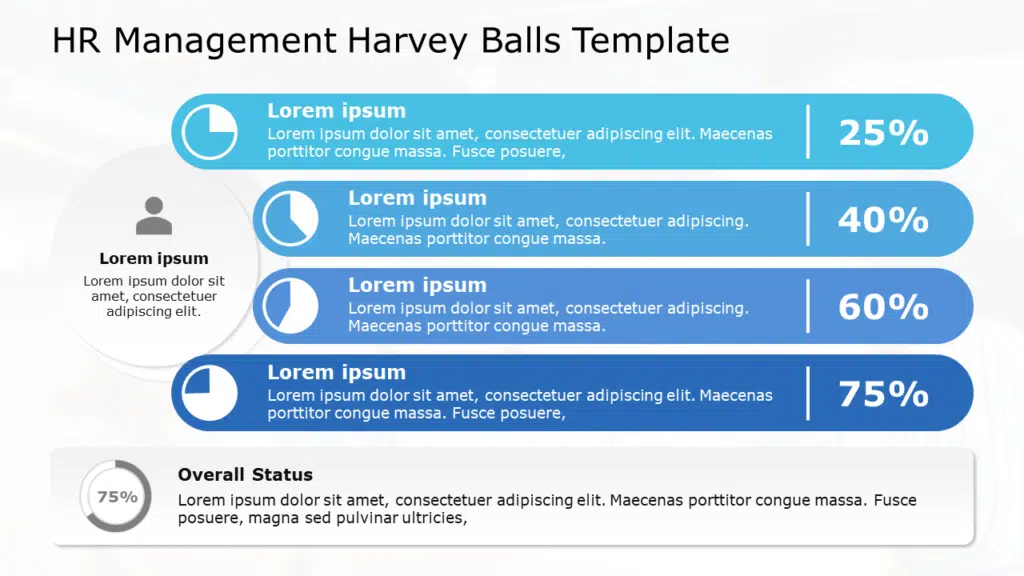
There are many ways in which these balls can help HR professionals showcase the employee performance and status of different initiatives to senior management. The above template is one of the examples highlighting an employee’s performance.
Harvey Balls PowerPoint Presentation for Sales & Financial Reporting
In financial reporting, these balls help draw visual graphs comparing financial metrics from different periods, divisions, or projects. Therefore, a specific metric’s relative performance or status is represented by a filled circle representing strong performance or attainment and an empty circle representing poor performance or deficiency.
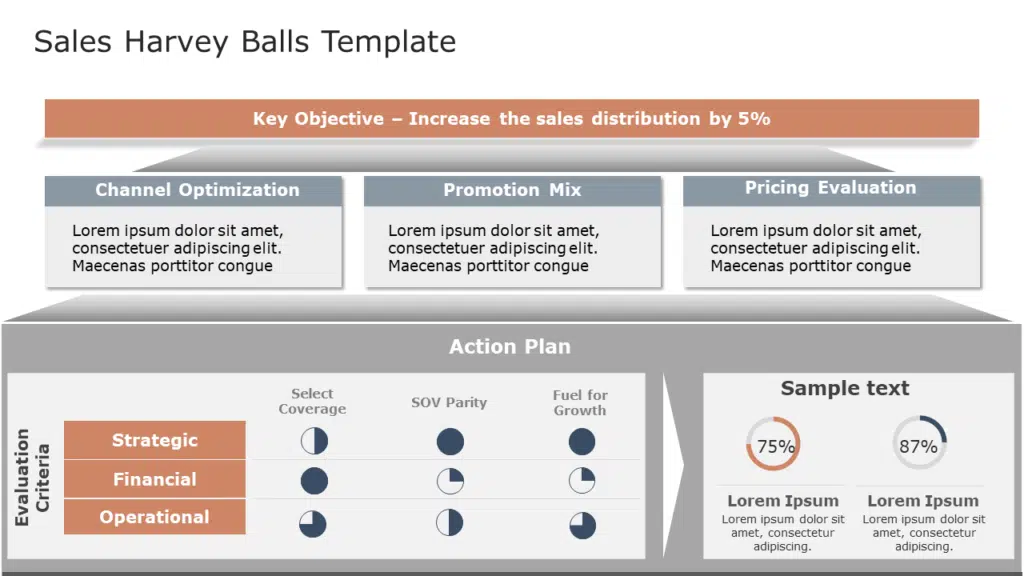
Integration of these balls into financial reports will provide an insight summary of financials to stakeholders and, on that score, improved decision-making and strategic planning realized. In addition, it highlights areas of concern or improvement, further calling for analysis or action where necessary.
Risk Assessment
The risk can be assessed by providing a visual indication of the risk whenever various factors or scenarios are involved. They could represent the level of exposure to risk or the probability and impacts of the various risks in different circles.
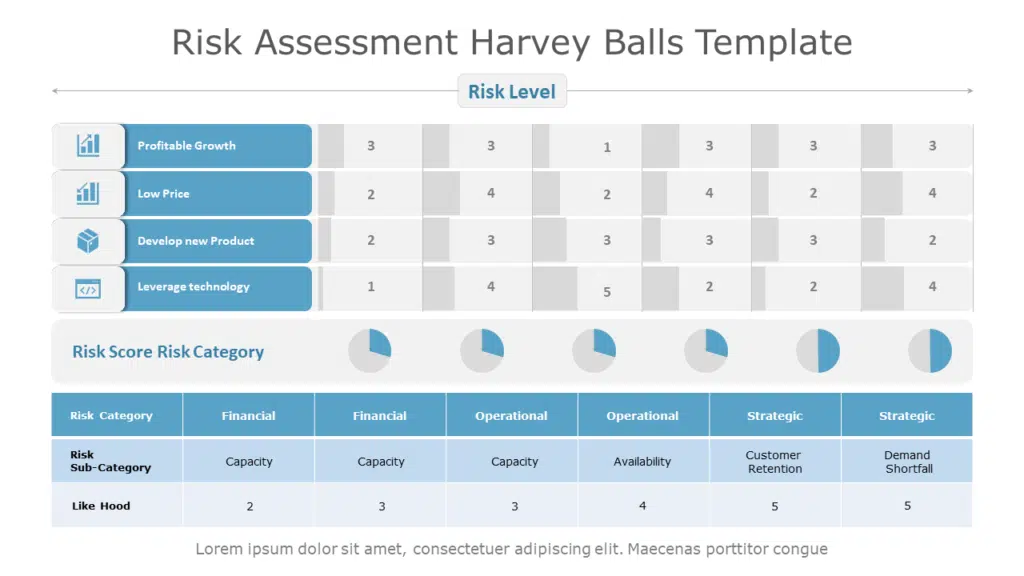
The above template can be utilized in risk assessment. It shows the risk category with its risk score showing the likelihood of occurrence. You can change the colors of the balls and the shaded portions in the Harvey balls PowerPoint.
Survey Or Feedback Analysis
They are used to analyze surveys or feedback to summarize responses to qualitative questions or rating scales. They can each represent the frequency or intensity of some particular response, giving a fast visual summary of the data for trends or patterns. In another illustration, the balls can indicate the distribution of answers along different rating levels, say satisfaction or agreement/disagreement, about statements. This scanning helps easily find common trends in the feedback data or outliers.
How To Create Harvey Balls in PowerPoint Presentation?
Now that you know all about Harvey Balls, the question you might have is – How can you implement them in your presentation? How to make Harvey balls in PowerPoint? We have written a step-by-step below for you to follow and create easily –
Step 1
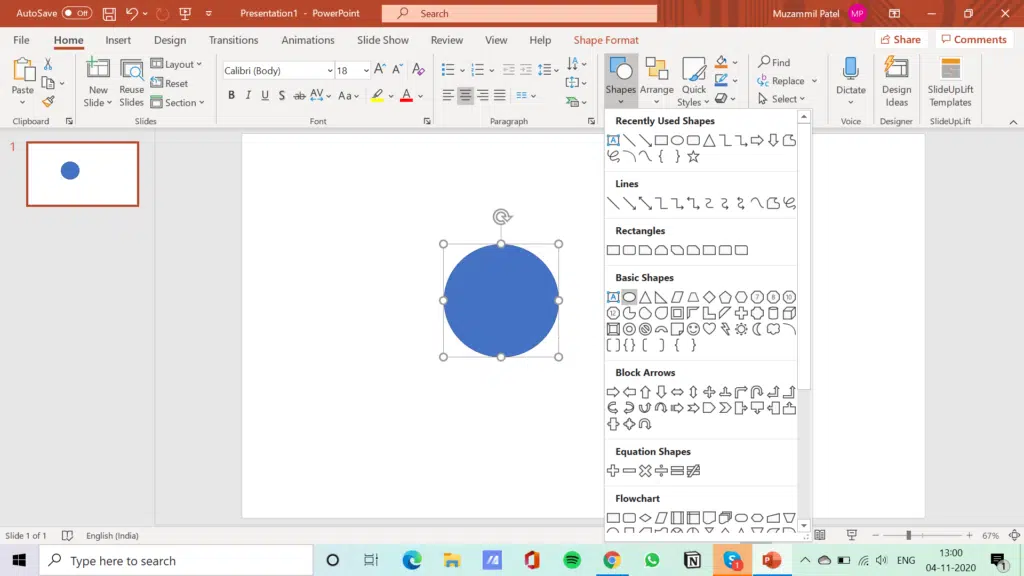
Go to the Insert tab in the top menu bar in PowerPoint. Click on “Shapes” and select the Oval shape. Hold Shift while you draw the circle on your slide.
Step 2
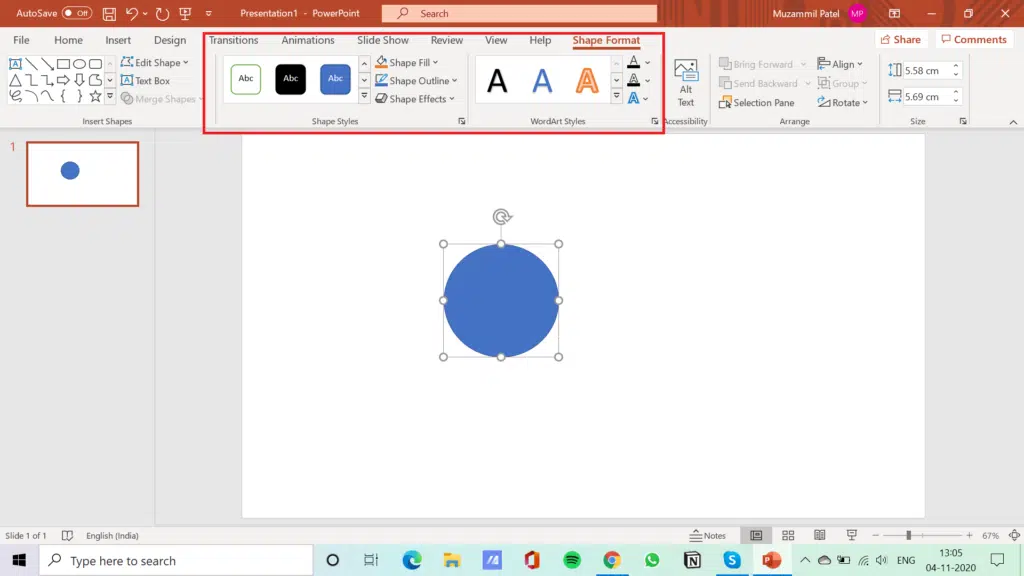
Format the circle you created in the Shape Format tab. You can choose one of the presets or create a custom Harvey ball by selecting an individual shape fill.
Step 3
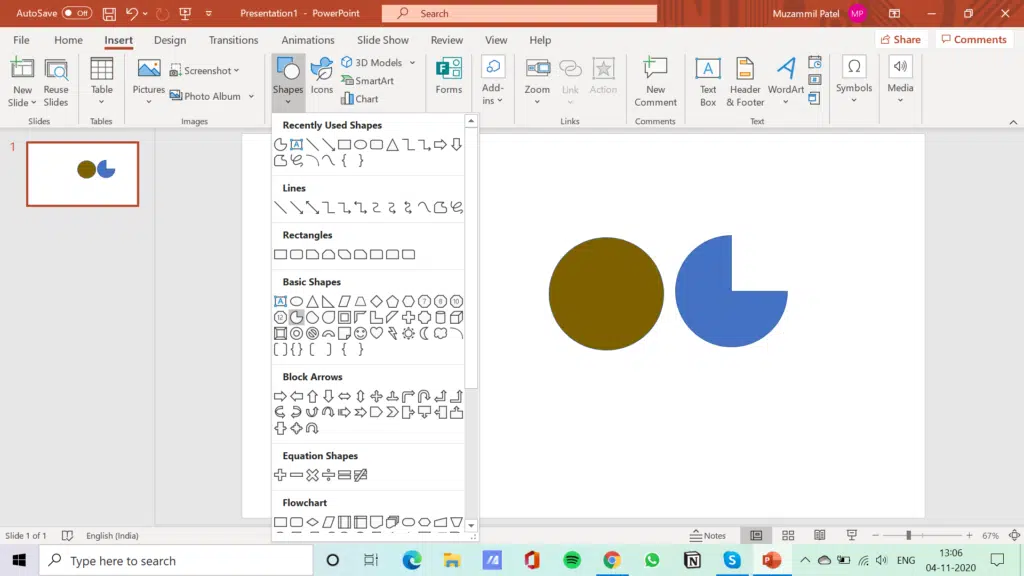
Once you have finished the circle design, go to the Insert tab again. Now, use the Partial circle. Draw a partial circle of the same size as the first circle by holding shift and dragging the mouse. You also have to format the partial circle.
Step 4
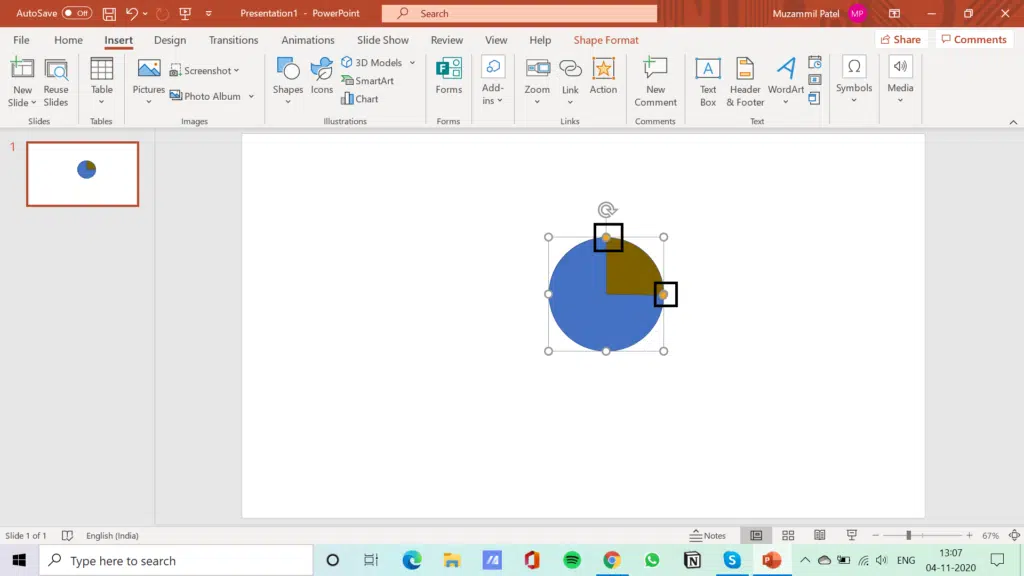
Put the partial circle exactly on top of the first circle. The partial circle has orange dots, which will allow you to change the “amount of circle” (shade)– you can adjust the ball as you like.
Step 5
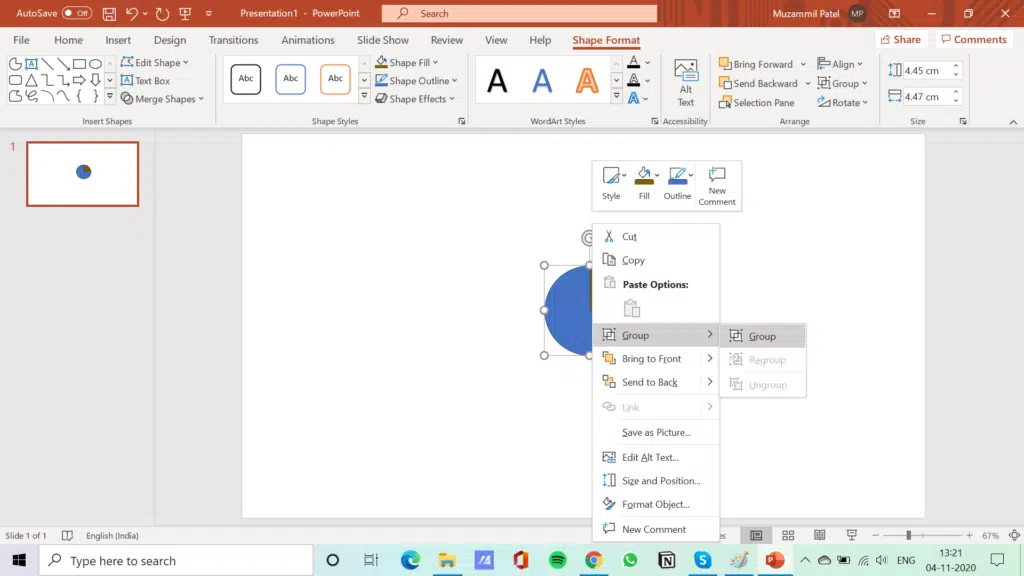
Hold your left mouse button and slide it over your created circle. Then right-click and select “Group” > “Group”. This converts your two shapes into one and allows you to move your Harvey ball around as a whole.
Harvey Ball Templates
Now, you have understood the concept and know how to create Harvey Balls in PowerPoint presentations. However, it might be challenging and time-consuming for you to create these presentations from scratch. That’s why we have created PowerPoint templates for you that you can use to start your presentations directly. We have discussed these different types below :
- Harvey Balls PowerPoint Template
- Business Growth Executive Summary PowerPoint Template
- Animated Project Status Report PowerPoint Template
- Capability Assessment PowerPoint Template
- Investment Portfolio PowerPoint Template
- Harvey Balls Template Collection
Harvey Balls PowerPoint Template
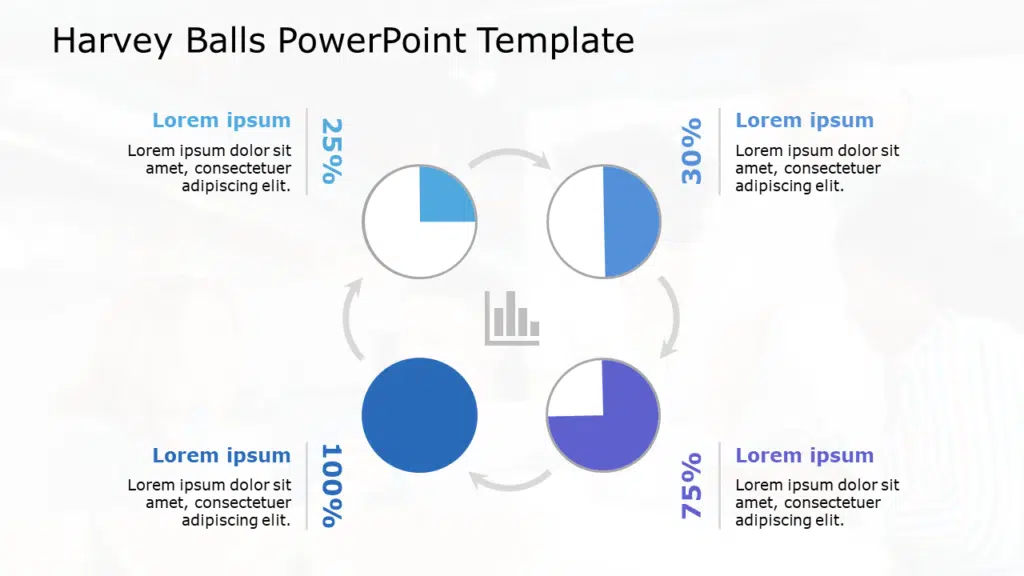
Business Professionals can use this Harvey balls chart template to present progress tracking and to communicate different levels of completion. It has four balls showing succession or completion with percentages. You can customize the percentage mentioned and use the balls to show your data. The slide is fully customizable and supports both MS PowerPoint and google slides format. Just download it and edit it according to your preferences.
Business Growth Executive Summary PowerPoint Template
This Harvey Ball analysis template helps display the various aspects of growth in business: analysis of the market, strategic initiatives, sales performance, and financial metrics. Represent the status or levels of achievements in various growth factors with customizable balls, enabling stakeholders to realize the most important trends and make informed decisions quickly.
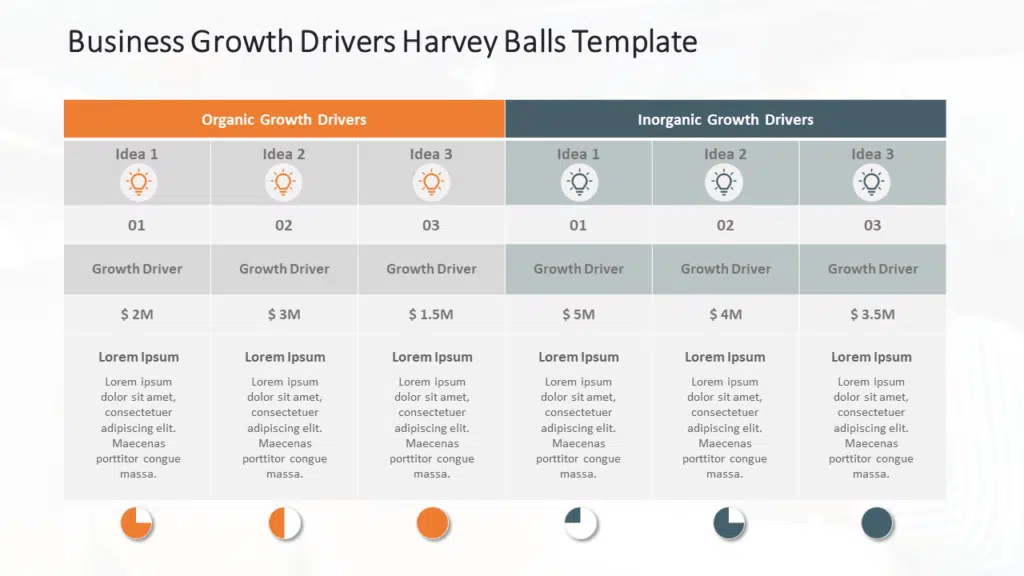
Whether it be to a group of executives, investors, or team members, it directs the entrepreneur through the very professional and polished layout of summarizing your business growth strategies and accomplishments made during that path.
Animated Project Status Report PowerPoint Template
The Animated Project Status Harvey Balls PowerPoint Template will visually represent tracking regarding project progress, milestones, and key performance indicators. This Template comes with animations. The animated elements add interactivity and visual appeal, making your presentations more engaging and memorable.

These balls allows you to express the status of various tasks in the project, risks, and dependencies, helping all parties understand within seconds what areas need more attention to get the project in an even better state. Just download it and customize it to your preferences.
Capability Assessment PowerPoint Template
The Capability Assessment PowerPoint Template helps to make organizational capability evaluation and presentation easier. The template gives a very clear and direct way of drawing any comparison between the different aspects of organizational strengths, weaknesses, and possible areas of development (SWOT). You can customize them with ease.
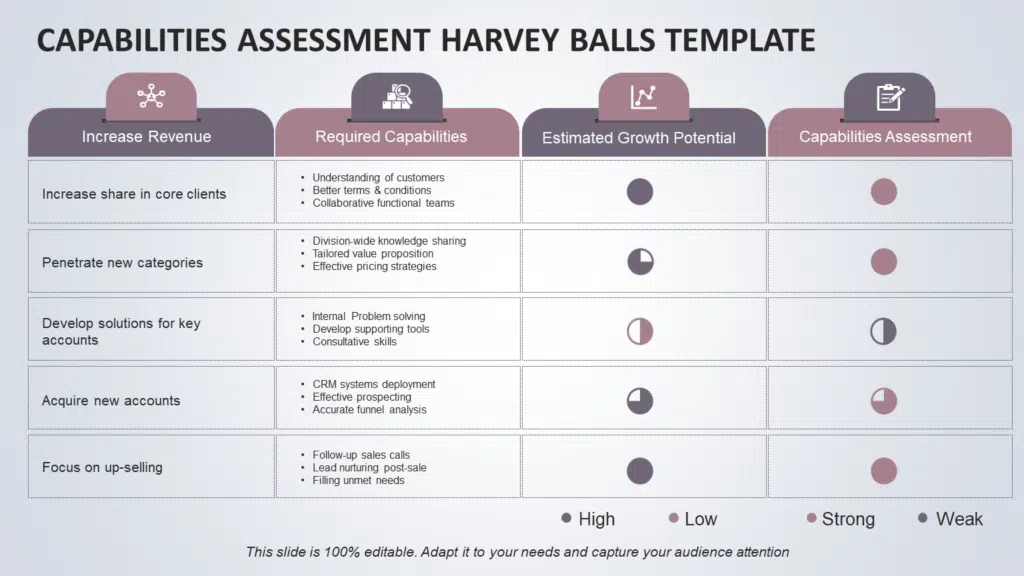
It has four sections: Increase revenue, Estimated growth potential, Required capabilities, and Capabilities assessment. You can add your goals and criteria in the first two columns. It will be helpful for your internal assessment. The slide is fully editable; you can download and use it.
Investment Portfolio PowerPoint Template
The Investment Portfolio Harvey Balls PowerPoint Template displays the investment portfolio with clarity. They are included in this slide to explain the performance, diversification, and risk profile for investment holding. Customizable balls allow users to communicate effectively the relative performance or allocation of different assets or investment strategies.
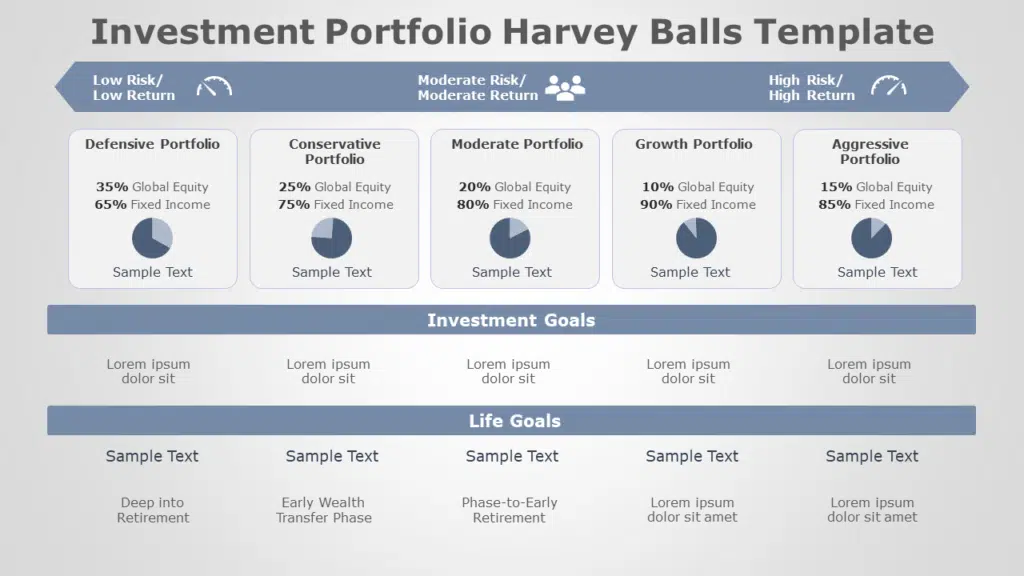
These slides have different backgrounds and focus on asset allocation, risk-return analysis, performance attribution, and key activities in investment portfolios. You can edit the slide and personalize it as per your investment portfolio.
Harvey Balls Template Collection
It is a collection of different types of Templates. It includes multiple graphic elements like Harvey balls icons and Harvey ball charts, which you can customize depending on your needs.
Tips to Make Perfect Harvey Balls
Follow the below-mentioned tips to make a perfect Harvey Balls PowerPoint presentation.
- Use PowerPoint shape tools to create simple circles.
- Maintain consistency in size and shape.
- Use color effectively to show different levels or categories. The selected colors should contrast nicely with the outline of the circle.
- Make sure to shade the circles in correspondence with the different levels of completion or achievement.
- Keep it simple, and avoid overcrowding them with too much detail.
Conclusion
Harvey balls are a great visual tool that you can use in PowerPoint presentations to make your presentation appealing and easy to understand. They are commonly used for tracking projects, comparing products or services, and even in official reports. What makes Harvey Balls PowerPoint so easy to understand is its ability to represent qualitative information effectively. You can also find other uses of this tool in your office, projects, etc. Use Slideuplift’s templates to create excellent presentations.
FAQs
-
Who invented Harvey Ball?
Harvey Ball was invented by Harvey Poppel, an American consultant and graphic designer, in the 1970s.
-
Are there alternatives for data visualization?
Yes, alternatives to Harvey Ball charts are pie charts, radar charts, and other visual communication tools, each with its own strengths and weaknesses depending on the data being represented.
-
What are some common mistakes to avoid when using Harvey Ball?
Common mistakes to avoid when using Harvey Ball PPT include using them without a clear understanding of the scale being used, overcrowding a document or presentation with too many balls, and using them inconsistently.
-
Can these balls be used in conjunction with other visual aids?
Yes, you can use it alongside other visual aids such as charts, graphs, or tables to provide additional context or emphasis to the data being presented.

