 Fall Sale
 Flat 40% off on our Unlimited Access Yearly Membership plan!

PowerPoint Templates
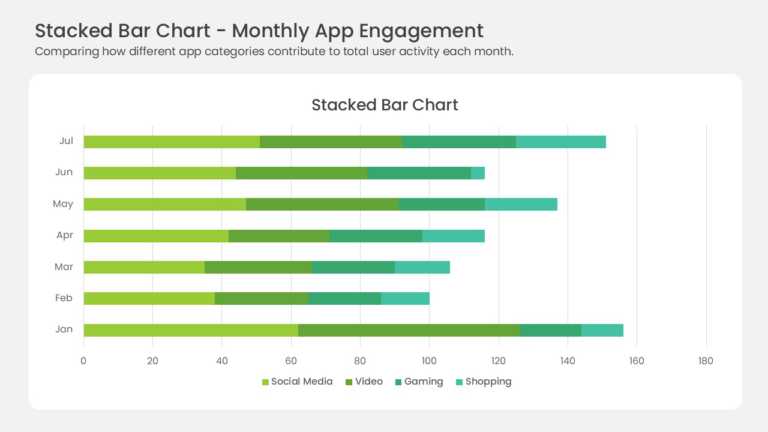
Seven horizontal bars stack four data series across the months January through July. Yellow-green, medium green, teal, and mint segments mark Soc....


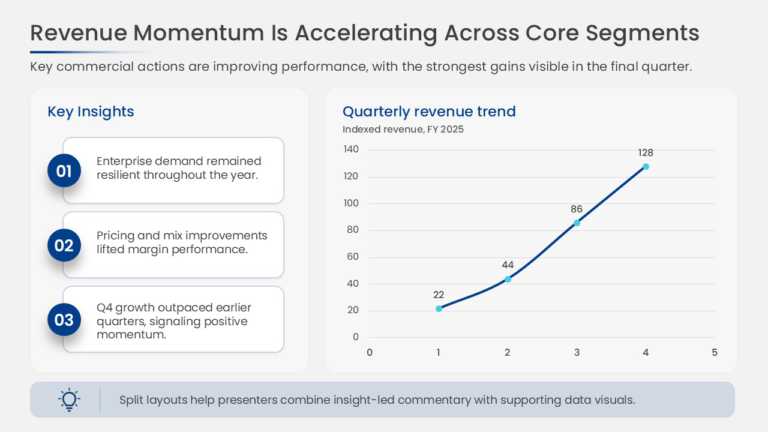
This slide charts revenue across quarters to show period-over-period growth and pairs the chart with insight callouts that explain the drivers be....

This section tracker slide lists the main sections of a presentation in sequence and highlights the section currently in progress. Visual markers....

This customer onboarding action plan organizes the onboarding journey into sequential stages. Each stage has space for key tasks, responsible own....
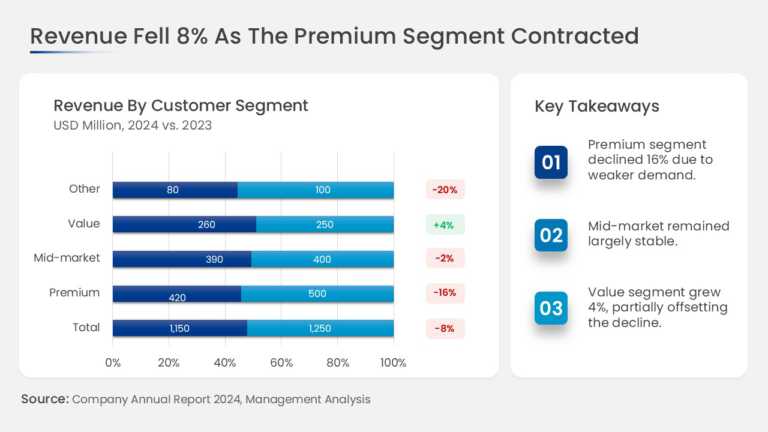
This slide combines a revenue chart broken down by business segment with a dedicated key takeaways panel. The chart area shows the revenue contri....
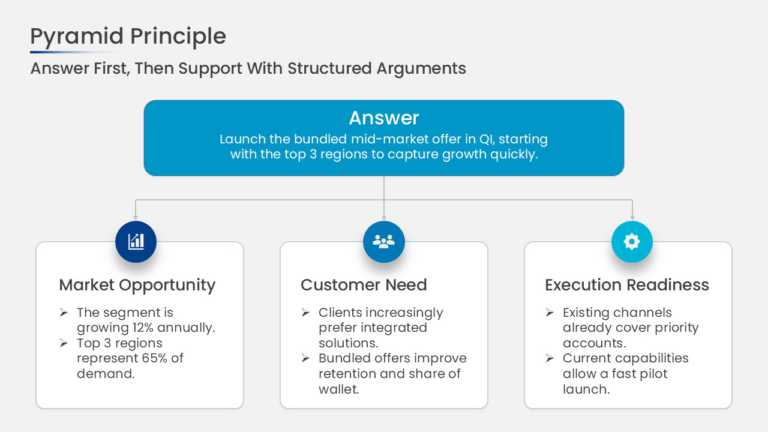
This pyramid principle slide places a single governing thought at the top of the structure with 3 supporting arguments arranged beneath it. Conne....
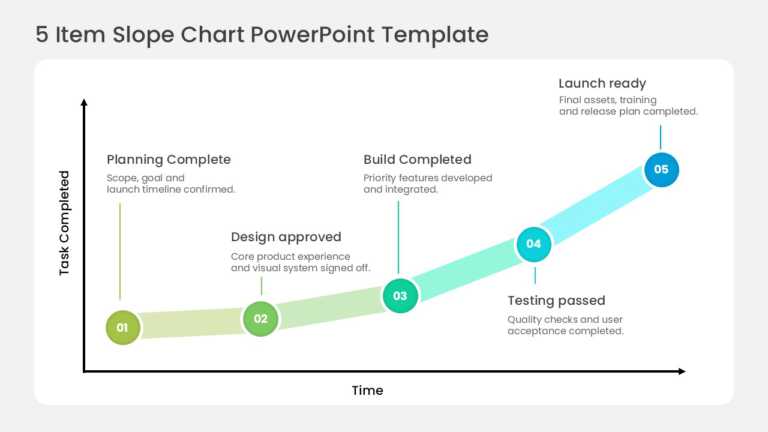
Five circular nodes climb an upward slope, tracking milestone completion across sequential delivery phases. The stages run from scope confirmatio....
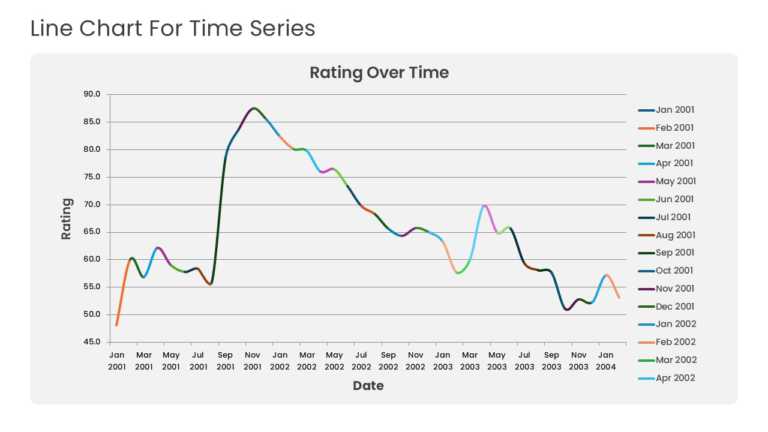
Multiple years of historical data run across a time-series line graph with point markers and gridlines. The layout highlights baseline momentum, ....

Opportunities are positioned on a bubble chart by market attractiveness and competitive position, and bubble size adds a third measure for revenu....
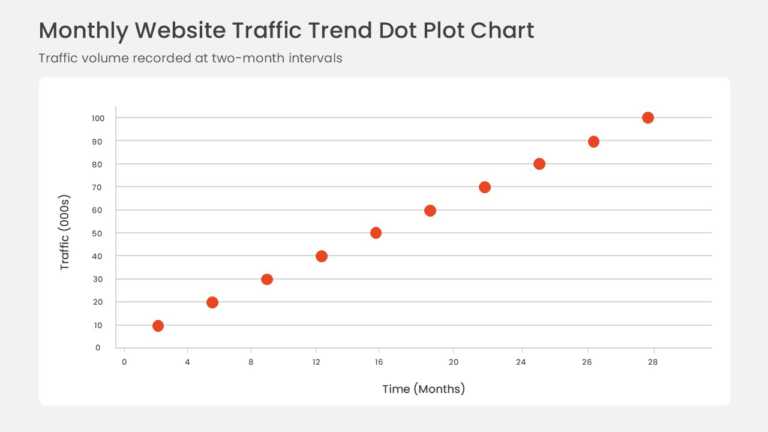
Data points plotted on horizontal and vertical axes form a scatter plot with a fitted linear trendline. The rising pattern shows a positive corre....
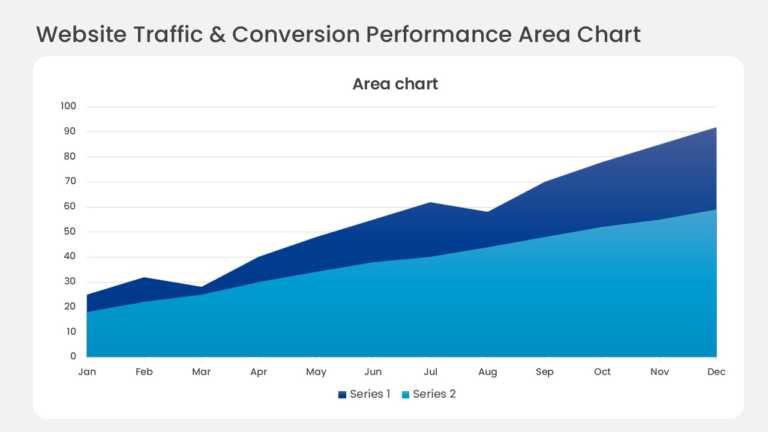
Layered bands in a monthly stacked area chart show website traffic by acquisition channel. The top edge tracks total visitors, and each colored b....
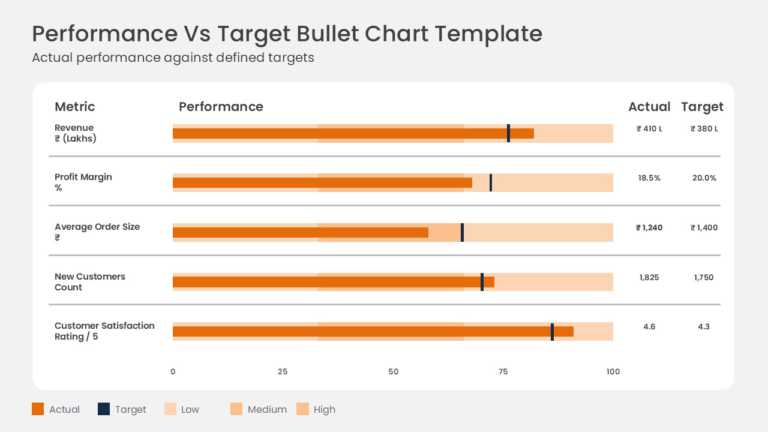
Actual results are measured against targets on horizontal bullet charts for metrics such as gross sales and operating margin. Each row combines a....