 Fall Sale
 Flat 40% off on our Unlimited Access Yearly Membership plan!

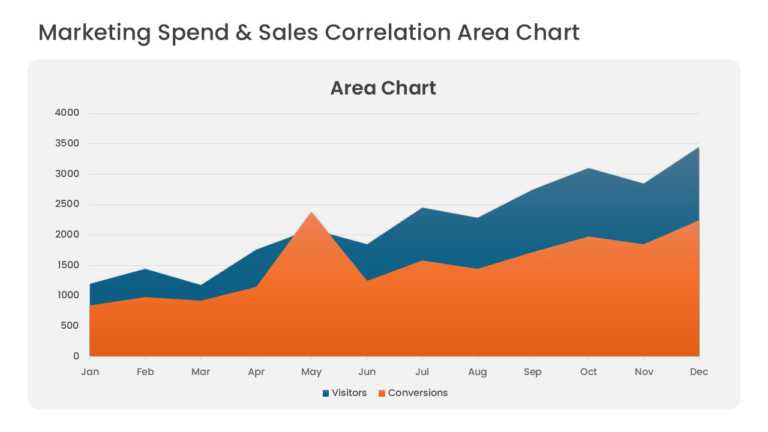
Overlapping area series compare marketing spend with sales revenue over consecutive periods. Translucent fills keep both series visible where the....


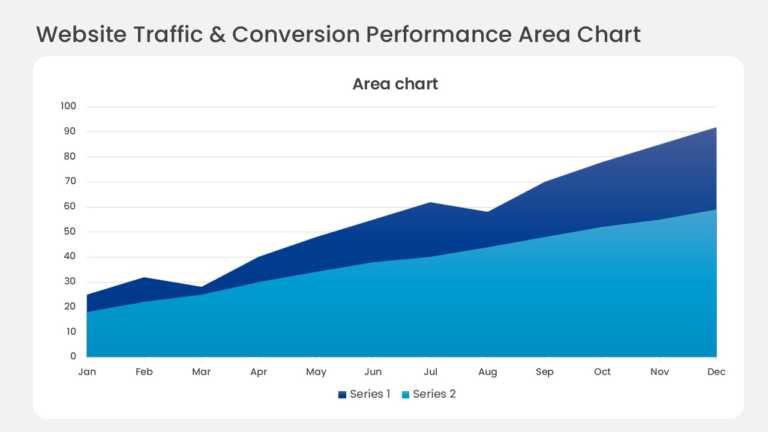
Layered bands in a monthly stacked area chart show website traffic by acquisition channel. The top edge tracks total visitors, and each colored b....
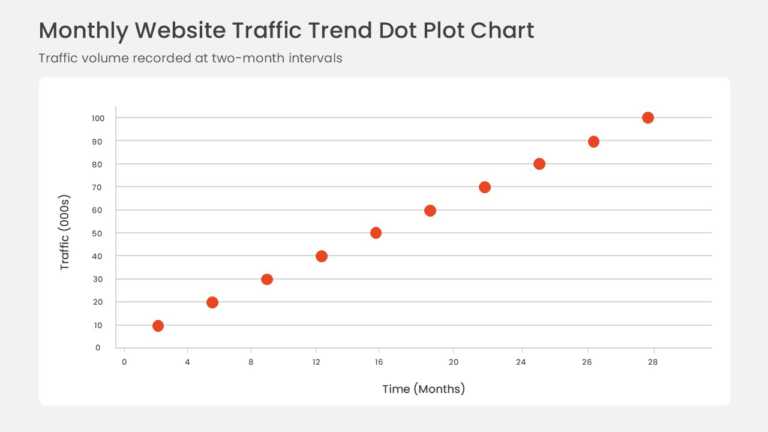
Data points plotted on horizontal and vertical axes form a scatter plot with a fitted linear trendline. The rising pattern shows a positive corre....

Opportunities are positioned on a bubble chart by market attractiveness and competitive position, and bubble size adds a third measure for revenu....
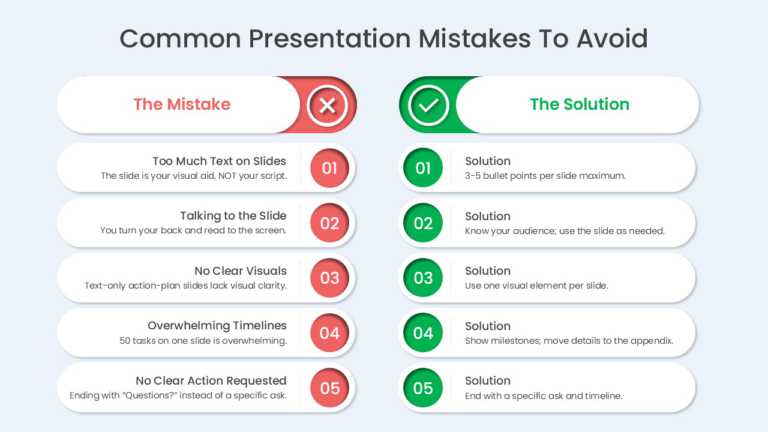
Three cards set common presentation design mistakes against their fixes. The cards address text-heavy slides, reading directly from the screen, a....
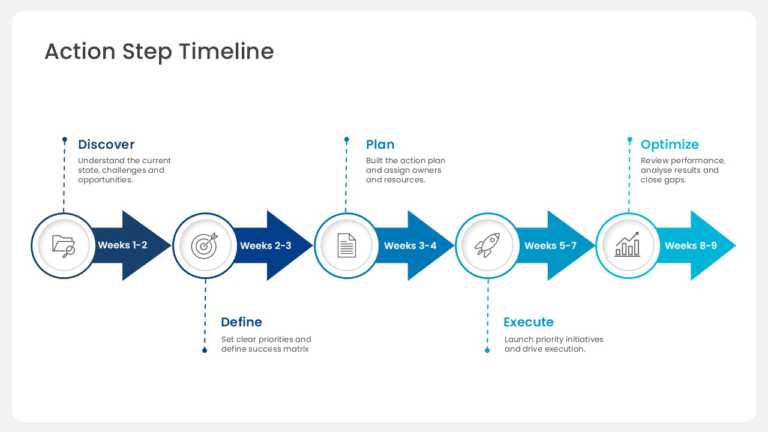
Discovery, scoping, planning, execution, and optimization form five sequential phases on a weekly action plan timeline. Each phase card carries a....
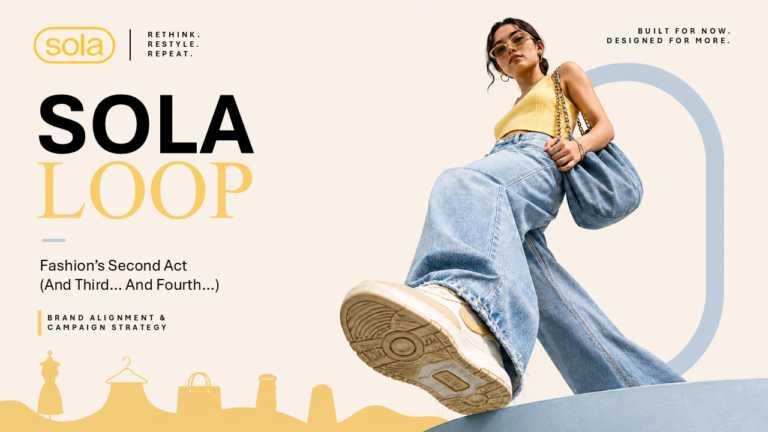
A three-slide deck presents a sustainable fashion campaign strategy built around circular product ideas. Editorial typography, text callouts, and....
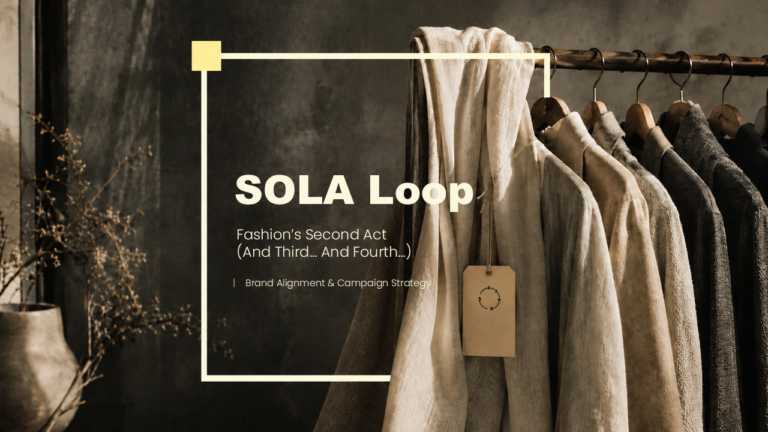
Product longevity, circular innovation, and youth audience engagement anchor a three-slide modern fashion marketing deck. High-contrast typograph....
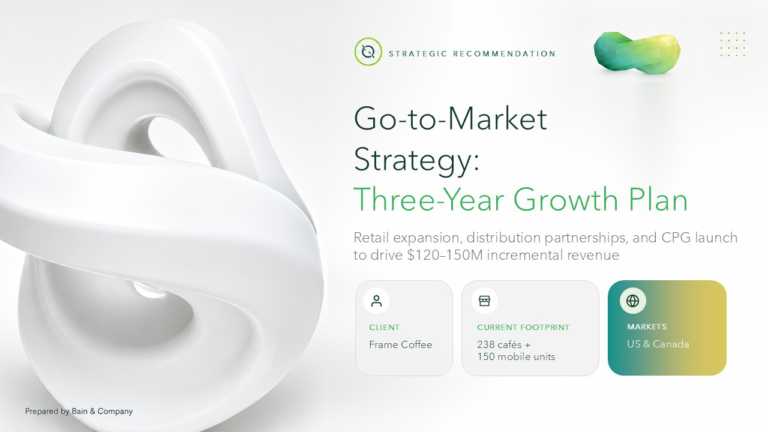
This four-slide deck follows a consulting-grade narrative built on a teal-to-lime gradient palette over soft grey cards. The cover splits into a ....
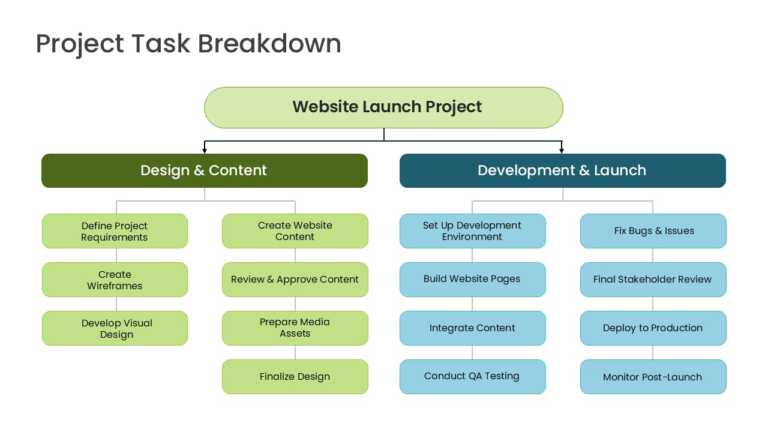
This slide presents a three-tier hierarchical work breakdown structure on a clean white canvas. A single pale-green root node labeled Website Lau....
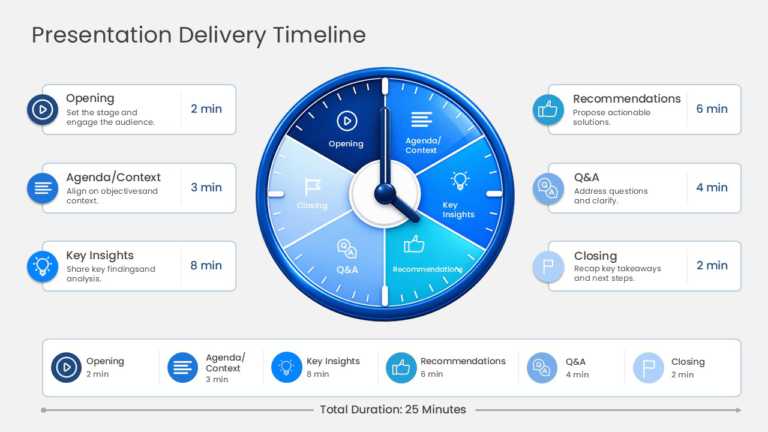
Six segments divide a clock dial into the stages of a business presentation. The segments cover opening context, agenda, key insights, recommenda....
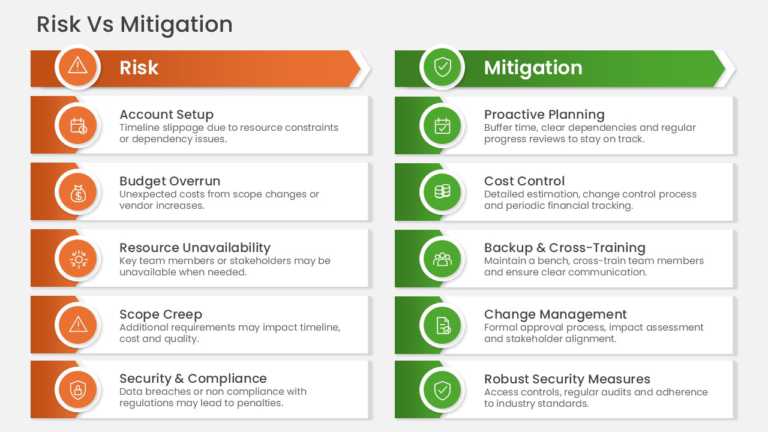
Two columns pair five project risks with their mitigation actions in a side-by-side comparison table. Rows address schedule slippage, budget over....
Related Presentations
-

PowerPoint Themes
246 templates>
-

Backgrounds
347 templates>
-

Executive Summary
258 templates>
-

Latest
4,916 templates>
-

Simple
121 templates>