 Fall Sale
 Flat 40% off on our Unlimited Access Yearly Membership plan!

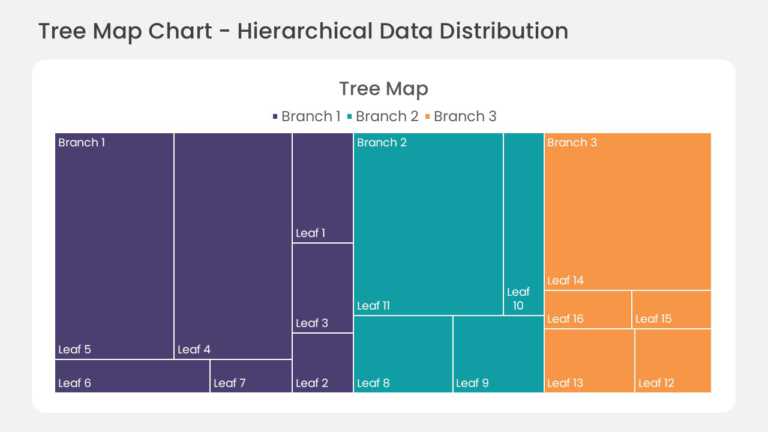
This hierarchical treemap chart divides the slide area into nested rectangles, with each rectangle sized by its share of the total value. Child s....



This section tracker slide lists the main sections of a presentation in sequence and highlights the section currently in progress. Visual markers....
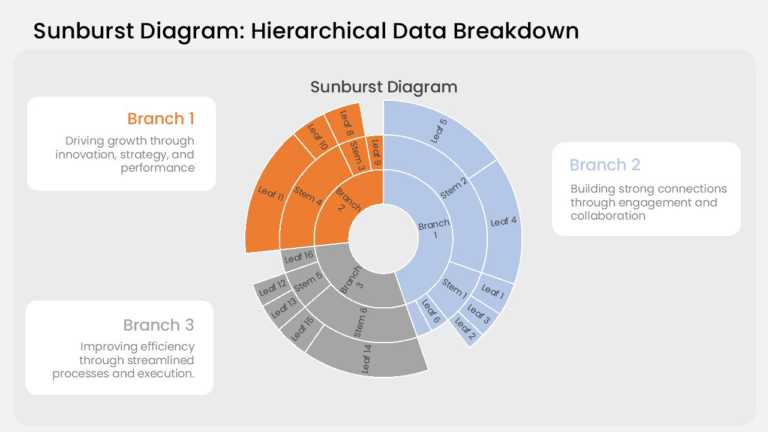
This sunburst chart arranges hierarchical data in three concentric rings. The inner ring holds the top-level categories, the middle ring breaks e....
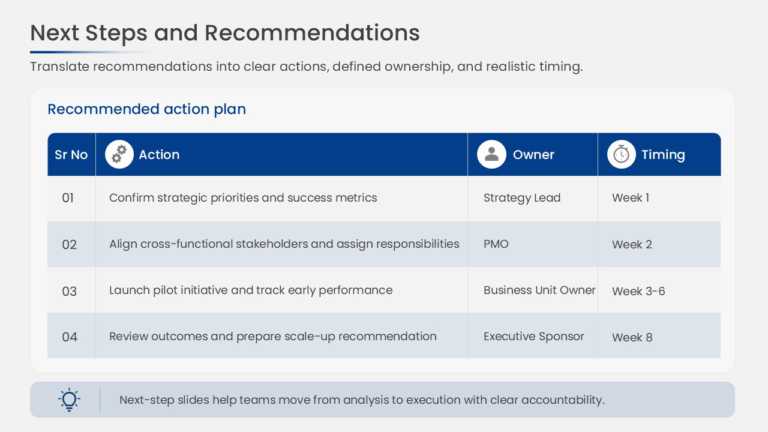
This project action plan uses a structured table with columns for action items, responsible owners, due dates, and status. Each row represents on....
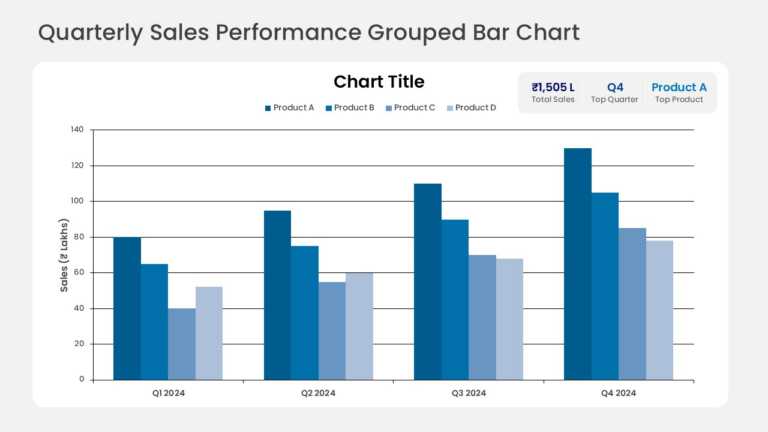
Grouped columns compare quarterly sales across several product lines, with one column per product in each quarter. KPI callout cards above the ch....
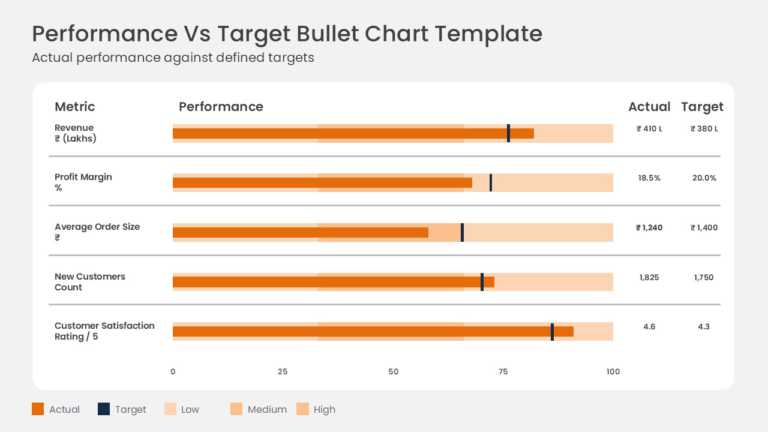
Actual results are measured against targets on horizontal bullet charts for metrics such as gross sales and operating margin. Each row combines a....
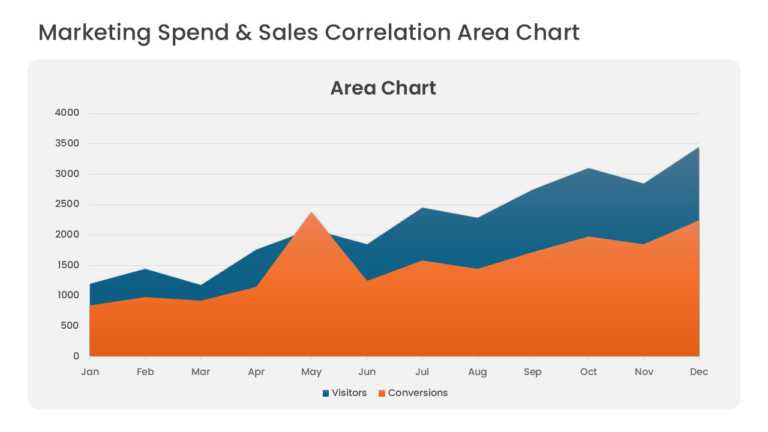
Overlapping area series compare marketing spend with sales revenue over consecutive periods. Translucent fills keep both series visible where the....
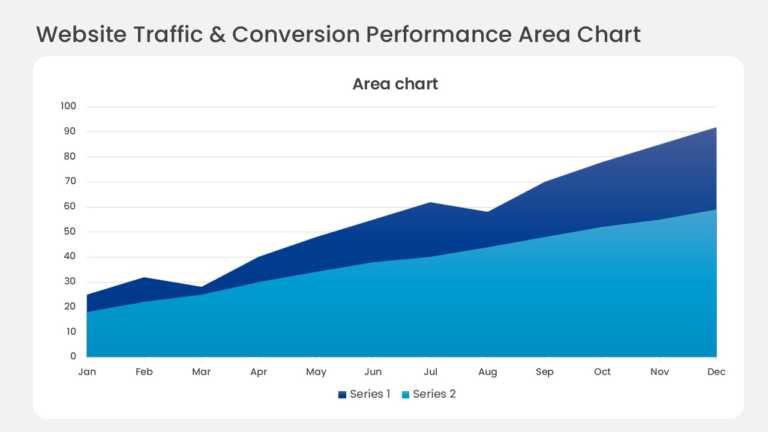
Layered bands in a monthly stacked area chart show website traffic by acquisition channel. The top edge tracks total visitors, and each colored b....
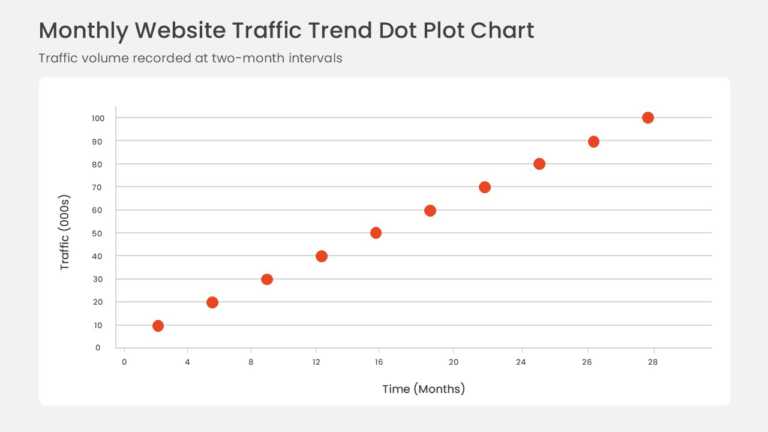
Data points plotted on horizontal and vertical axes form a scatter plot with a fitted linear trendline. The rising pattern shows a positive corre....

Opportunities are positioned on a bubble chart by market attractiveness and competitive position, and bubble size adds a third measure for revenu....
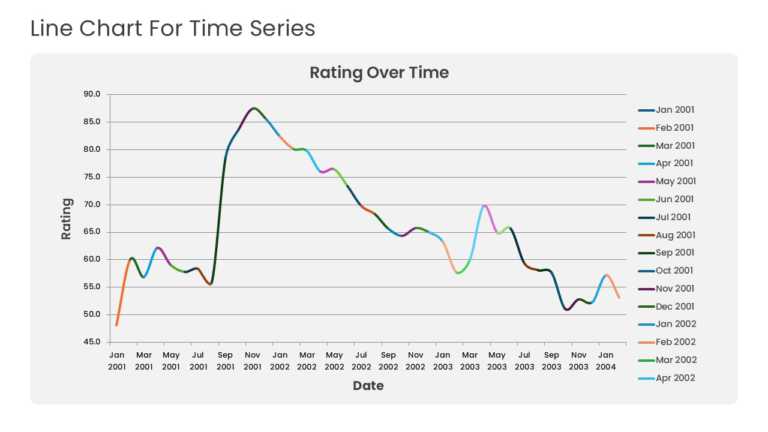
Multiple years of historical data run across a time-series line graph with point markers and gridlines. The layout highlights baseline momentum, ....
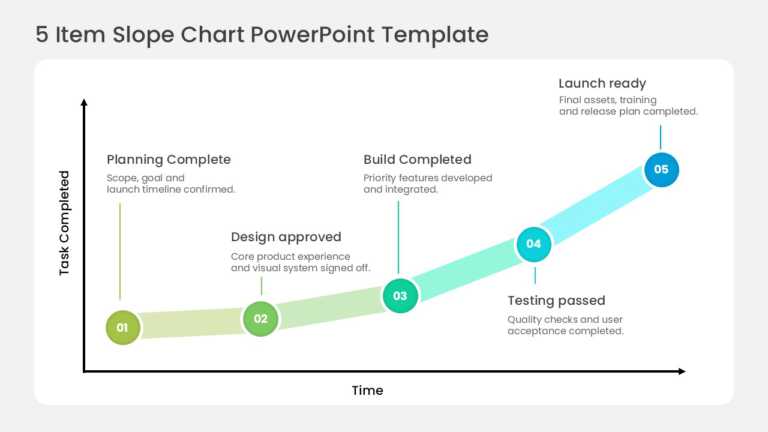
Five circular nodes climb an upward slope, tracking milestone completion across sequential delivery phases. The stages run from scope confirmatio....
Related Presentations
-

PowerPoint Themes
246 templates>
-
Backgrounds
347 templates>
-
Executive Summary
256 templates>
-
Latest
4,912 templates>
-
Simple
120 templates>


