
 Flat 4


Presentation Statistics: What You Need to Know for Your Next Presentation
Presentations are still where decisions get made: in boardrooms, classrooms, sales calls and investor meetings. What has changed heading into 2027 is how decks are built and how people consume them. AI assistants now draft and edit slides inside PowerPoint and Google Slides, attention is split across screens and notifications, and many decks are read on a phone before anyone presents them.
This guide brings together the presentation statistics that matter for 2026–2027. Each one comes with its source and year, so you can quote it with confidence. It covers attention span and length, slide design, preparation time, audience engagement, AI and software adoption, and pitch decks. You can also download the three editable templates featured below to present these numbers in your own deck.
Key presentation statistics for 2026–2027
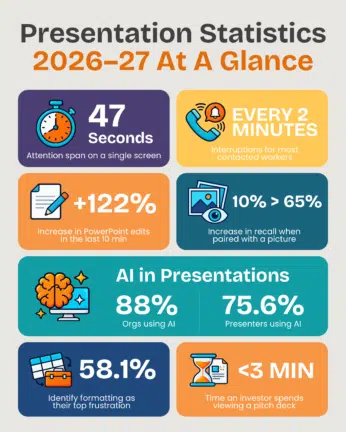
- Attention on a single screen lasts about 47 seconds on average (Gloria Mark, UC Irvine). The popular “8-second attention span” claim is not supported by evidence.
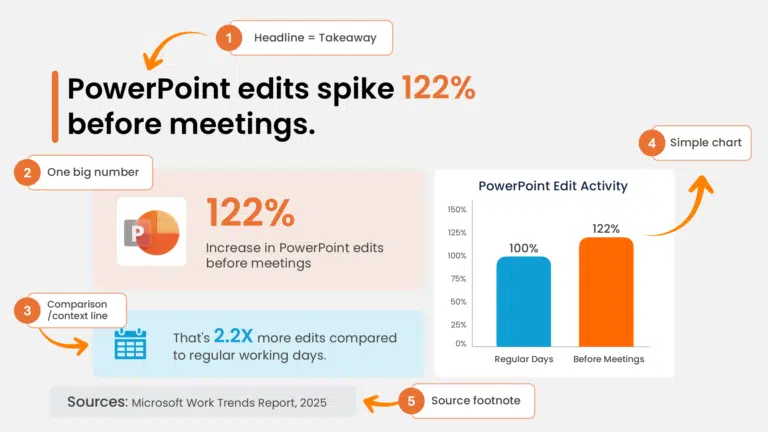
- The most-contacted Microsoft 365 users are interrupted every 2 minutes during core work hours, and PowerPoint edits spike 122% in the 10 minutes before a meeting (Microsoft Work Trend Index, 2025).
- Three days later, people remember about 10% of what they heard, but about 65% when a picture is added (John Medina, Brain Rules).
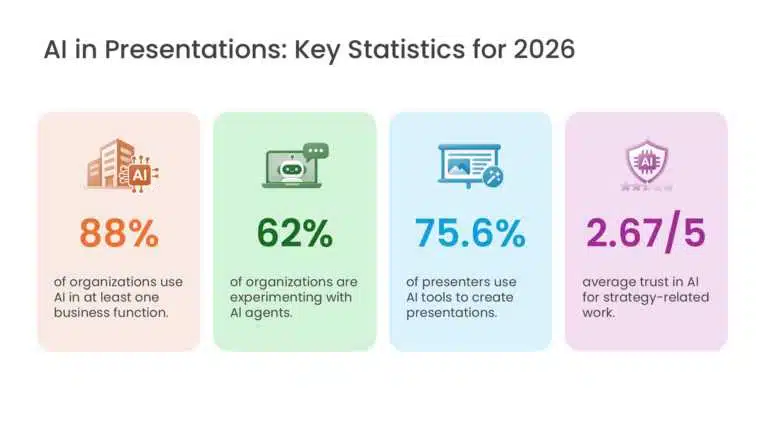
- 88% of organizations regularly use AI in at least one business function (McKinsey, November 2025), and 75.6% of presenters surveyed use AI tools in their presentation workflow (Decktopus, 2026).
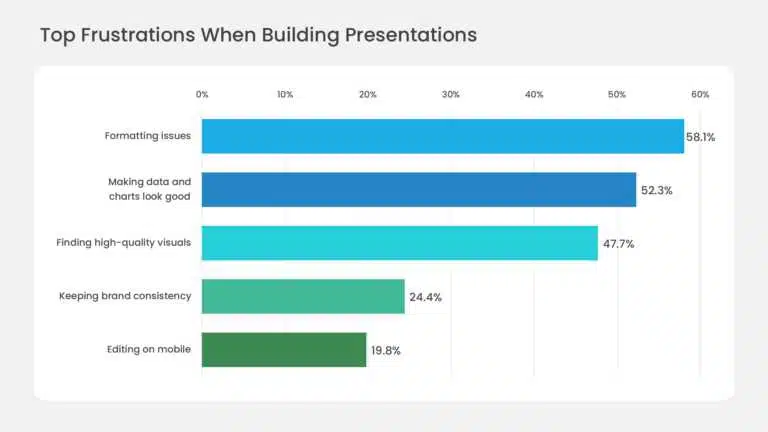
- Formatting (58.1%) and making data and charts look good (52.3%) are the top frustrations when building slides (Decktopus, 2026).
- Interactive decks are read to the end 41% more often (Storydoc), yet about 70% of presenters rarely or never use interactive elements (Decktopus, 2026).
- Investors spend less than 3 minutes reviewing a pitch deck (DocSend).
Attention Span and Presentation Length Statistics
Audiences give you less uninterrupted attention than they used to, but the numbers are often misquoted. Here is what the evidence actually says.
Most audiences say they can focus for 10–15 minutes
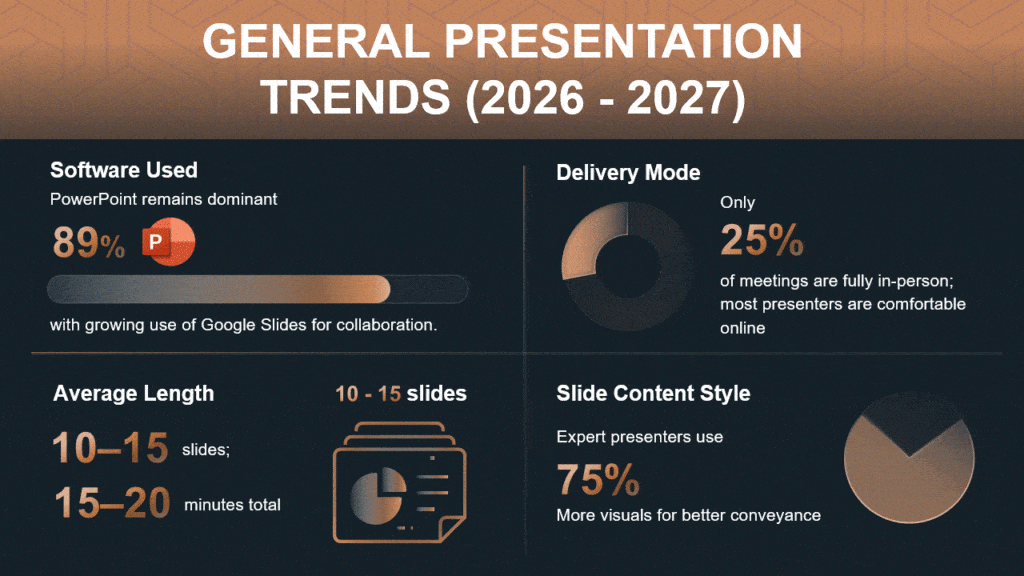
In a 2020 Decktopus survey of more than 300 people, most respondents said they can stay focused on a presentation for 10 to 15 minutes. That lines up with Guy Kawasaki’s 10/20/30 rule, which advises keeping a pitch under 20 minutes. If your slot is longer, change the pace every 10–15 minutes with a question, a demo or a story instead of adding more slides. Not sure how many slides you need? See how many slides for a 30-minute presentation.
Attention on a single screen lasts about 47 seconds
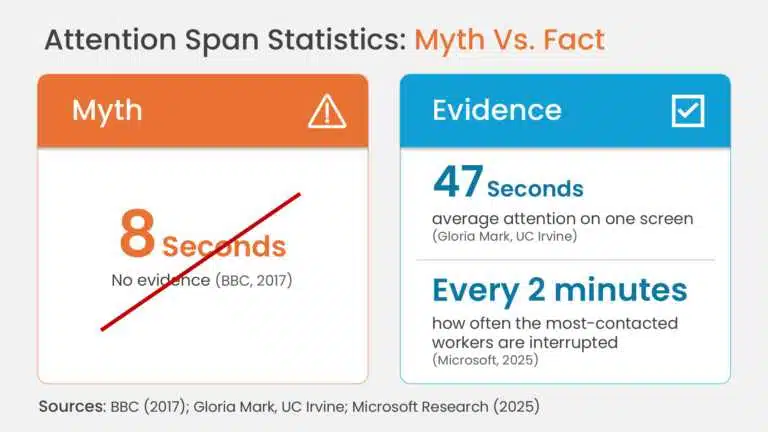
The widely shared claim that human attention spans have shrunk to eight seconds (“shorter than a goldfish”) comes from a 2015 Microsoft Canada marketing report, and the BBC found no evidence to support it. The better-documented figure comes from Dr. Gloria Mark of UC Irvine. Her research found that people’s attention on any one screen averaged about 2.5 minutes in 2004 and about 47 seconds in recent years (median: 40 seconds).
Her studies measure how often people switch screens during computer work, not attention during a talk. But they explain why every slide needs one point that people can grasp at a glance.
10 slides is the best-known benchmark for a pitch
The “10 slides” benchmark comes from Guy Kawasaki’s 10/20/30 rule: 10 slides, no more than 20 minutes, and no font smaller than 30 points. It is advice for investor pitches, not survey data. Audience preferences point the same way: in Decktopus’s 2020 survey, 34.6% of respondents preferred 5–9 slides and another 34.6% preferred 10–14. Keep one idea per slide and move supporting detail to an appendix slide. The 5-5-5 rule is a quick way to check text density.
Workers are interrupted every 2 minutes
Distraction doesn’t stop when the meeting starts. Microsoft’s 2025 Work Trend Index found that the most-contacted Microsoft 365 users (the top 20% by volume) are interrupted by a meeting, email or chat every 2 minutes during core work hours, or about 275 times a day. Nearly half of employees (48%) say their work feels chaotic and fragmented. In the 2020 Decktopus survey, about a fifth of participants said they looked at another screen constantly during presentations.
Open with your main point, not your agenda, and give people a reason to look up. These ways to start a presentation help.
Presentation Design and Visual Statistics
Nearly half of presenters struggle to find good visuals
Audiences expect visuals, and producing good ones is hard. In Decktopus’s 2026 survey, 47.7% of respondents named finding high-quality visuals and images as a top frustration, and 52.3% said the same about making data and charts look good. A small set of well-chosen charts and infographics does more than many decorative images. Our guide to types of charts shows which chart fits which kind of data.
Almost half of people want text on no more than a quarter of the slide
In Decktopus’s 2020 survey, almost half of respondents preferred text to cover no more than a quarter of a slide, and most of the rest accepted up to half. Presenters say they already work this way: in a 2018 Venngage survey of nearly 400 marketing influencers, 54.9% said less than 25% of their presentations was text. The 6×6 rule and the 5-5-5 rule are two simple limits to follow.
People remember 10% of what they hear, but 65% when a picture is added
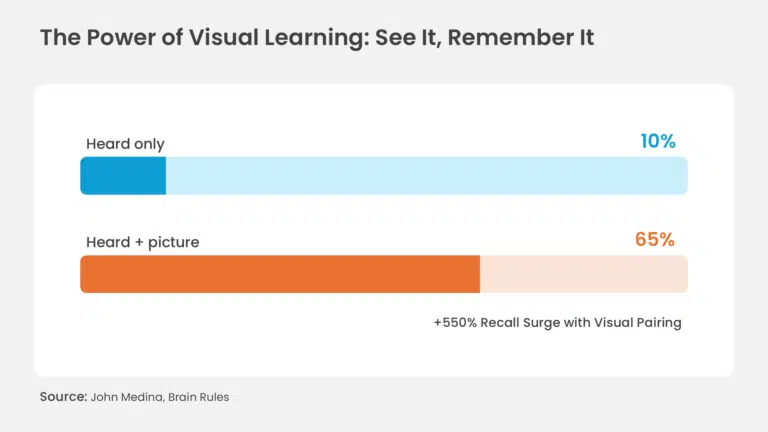
According to molecular biologist John Medina in Brain Rules, people remember about 10% of information they hear three days later. Add a picture and they remember about 65%. This “picture superiority” effect is why one clear chart or image usually beats a paragraph of text on a slide.
Visual aids made presentations 43% more persuasive in a classic study
A 1986 University of Minnesota study sponsored by 3M (Vogel, Dickson and Lehman) found that presentations using visual aids were 43% more persuasive than the same presentations without them. The authors’ conference paper on the same research reports 46%. It is an old study, so quote it with its year. It remains the most-cited figure on visual aids.
Video lifts deck engagement by up to 29%
Storydoc’s analysis of more than 1.3 million deck-reading sessions found that a video anywhere in a deck raised engagement by 14%, and an intro video in the first three slides by 21%. A background video on the cover plus an early intro video raised it by 29%.
Motion works when it explains something. Use animations, transitions and Morph to reveal a sequence or show a change, not as decoration, and keep them consistent across the deck. That is one of the easiest ways to make PowerPoint presentations attractive without distracting your audience. You can also embed a YouTube video in PowerPoint in a few clicks.
Note for content manager: this keeps the existing internal link “to make PowerPoint presentations attractive”.
Presentation Creation and Preparation Statistics
83% create or deliver presentations at least a few times a month
In Decktopus’s 2026 survey of 100+ professionals, academics and students, 83% create or deliver presentations at least a few times a month, and 44% do so weekly or more. For most people, presenting is a regular part of the job, not an occasional event.
PowerPoint edits spike 122% in the last 10 minutes before a meeting
Microsoft’s 2025 Work Trend Index found that edits in PowerPoint jump 122% in the final 10 minutes before a meeting. Microsoft calls it the digital equivalent of cramming for an exam. Decks take real time to build: in Decktopus’s 2020 survey, over 60% of respondents said it took them at least a couple of hours to put together a decent-looking presentation.
Blocking time the day before, and starting from a ready-made structure, removes most of that last-minute scramble. Here is a realistic look at how much time it takes to prepare a presentation.
Editing an old deck is the most common way to start a new one
Decktopus’s 2026 survey found that editing a previous presentation is the most common way people start a new deck. It comes ahead of planning with an AI chat tool, starting from a blank slide, using a pre-designed template, or having AI draft the first version. In its 2020 survey, about 75% said they had reused the same deck at least once.
Reusing saves time, but only if you refresh the deck. Update the numbers, dates and branding before you present.
Note for content manager: the old claim “half rely on templates” is wrong (the 2020 survey says 50% start from scratch), so it is not carried over.
58% say formatting is their biggest frustration when building slides
For most people, production is harder than coming up with ideas. In Decktopus’s 2026 survey, 58.1% named formatting issues (elements shifting and misaligning) as a top frustration. Next came making data and charts look good (52.3%), finding high-quality visuals (47.7%), keeping brand consistency (24.4%) and editing on mobile (19.8%).
Editable, professionally designed templates take most of this work off your plate, which leaves more time to rehearse and build your presentation skills.
Note for content manager: this keeps the existing internal link “presentation skills”.
Audience Engagement and Storytelling Statistics
Stories are up to 22 times more memorable than facts alone
Stanford’s Women’s Leadership Innovation Lab, featuring marketing professor Jennifer Aaker, notes that stories are up to 22 times more memorable than facts or figures alone. Give each key number a short story: a customer, a before-and-after, or a decision it changed. Our storytelling tips and guide to building a storyline show how.
Interactive decks are read to the end 41% more often
Storydoc’s analysis of more than 1.3 million reading sessions found that decks with interactive elements, such as live data calculators or sliders with case studies and testimonials, were scrolled to the end 41% more often and read 21% longer than static decks. Yet interactivity is still rare. In Decktopus’s 2026 survey, 34.9% never use interactive elements and another 34.9% rarely do.
Live polls, quizzes and Q&A slides are the easiest place to start. Try these interactive presentation ideas or build a quiz in PowerPoint with no add-ins.

Presentation Software and AI Statistics for 2026–2027
PowerPoint is still the most-used presentation tool, and AI-first rivals are scaling fast
A 2023 Censuswide survey for Acuity Training of more than 2,000 UK adults found that 20.3 million people aged 16 and over in the UK (37.15%) have used PowerPoint, making it the most popular presentation platform there. Newer tools are growing quickly. Gamma reported about 70 million users and more than $100 million in annual recurring revenue in November 2025. Canva passed 265 million monthly active users across all its products in 2025.
Comparing tools? See our ranking of the best presentation software and the pros and cons of PowerPoint.
A third of decks are opened on mobile
Storydoc’s data shows that 32% of decks shared through its platform are opened on a mobile device. If you send a deck before or after a meeting, make sure it reads well on a phone: large type, one idea per slide, and charts that still work at small sizes.
Note for content manager: the sentence “Roughly a third of professionals now present from mobile devices” is removed. The data is about opening decks, not presenting.
88% of organizations now use AI, and three in four presenters do too
McKinsey’s State of AI survey (November 2025, 1,993 respondents) found that 88% of organizations regularly use AI in at least one business function, up from 78% a year earlier. 62% are at least experimenting with AI agents. Presenters are following: in Decktopus’s 2026 survey, 75.6% use AI tools in their presentation workflow, and half use AI every time or most of the time.
Trust is lower than use. The same respondents rated their trust in AI for creative decisions at 2.87 out of 5 and for strategic decisions, such as what to show and how to structure an argument, at 2.67 out of 5.
Want to try it? See how to use Claude for PowerPoint, whether ChatGPT can make PowerPoints, and how Creatos AI builds decks from designed slides.
Presentation Trends to Watch in 2027
These trends are based on product changes that have already shipped or been announced in 2025–2026, not on predictions.
1. AI agents that edit the deck you already have
In April 2026, Microsoft made Copilot’s agentic capabilities in Word, Excel and PowerPoint generally available. In PowerPoint, Copilot can update an existing deck with the latest talking points and data while keeping your company’s template. That fits how people already work, since editing an old deck is the most common starting point. In 2027, expect more requests like “update this deck” and fewer like “make me a deck”. Compare the assistants in Copilot vs ChatGPT.
2. Slides generated from your own documents
n March 2026, Google updated Gemini in Google Slides. It now writes the messaging and builds layouts that match your other slides, and it turns sketches or tables into editable charts and diagrams. Google also announced that Gemini will generate a full presentation from your Workspace files. NotebookLM’s Slide Decks feature, introduced in November 2025, turns research notes and sources into slides.
3. AI-generated infographics inside the slide editor
Since November 2025, eligible Google Slides users can generate infographics from a prompt with the Nano Banana Pro image model. Visual data is getting faster to make, so checking every AI-generated number against its source matters more than ever.
4. Starting from proven designs instead of a blank page
Presenters trust AI more with design (2.87/5) than with strategy (2.67/5), according to Decktopus’s 2026 survey. The tools gaining ground keep the human in charge of the story and use AI for the layout. Creatos AI, SlideUpLift’s AI presentation maker, works this way: it builds on a library of more than 40,000 professionally designed slides instead of generating layouts from scratch.
5. Decks built for hybrid and async audiences
Nearly a third of meetings (30%) now span multiple time zones, according to Microsoft’s 2025 Work Trend Index. Since August 2026, Google Meet’s “Take notes for me” can capture screenshots of presented slides in the meeting notes. Your slides increasingly become the record of the meeting, so they must make sense without you speaking over them. See how to present a PowerPoint online or turn a deck into a video.
6. More interactive, conversational presentations
Respondents to Decktopus’s 2026 survey said they expect presentations to become more interactive and conversational. Right now, the main blockers are that the audience doesn’t expect it, tools don’t support it well, and it takes time to set up. Built-in features such as PowerPoint quizzes and Q&A slides are the lowest-effort way to start.
Pitch Deck Statistics
Pitch decks are where presentation statistics carry the most weight. DocSend’s pitch deck research shows how little time a deck gets:
- Investors spend less than 3 minutes reviewing a pitch deck.
- Most pitch decks are roughly 20 pages long, with about 50 words per slide.
- In 2020, investors spent over 4 minutes on decks that went on to raise money, and only 1 minute 30 seconds on decks that did not.
Put the problem, product and “why now” up front, and cut anything that does not support the ask. Browse 20+ real pitch deck examples and these tips for the perfect startup pitch deck.
Industry-Specific Presentation Trends
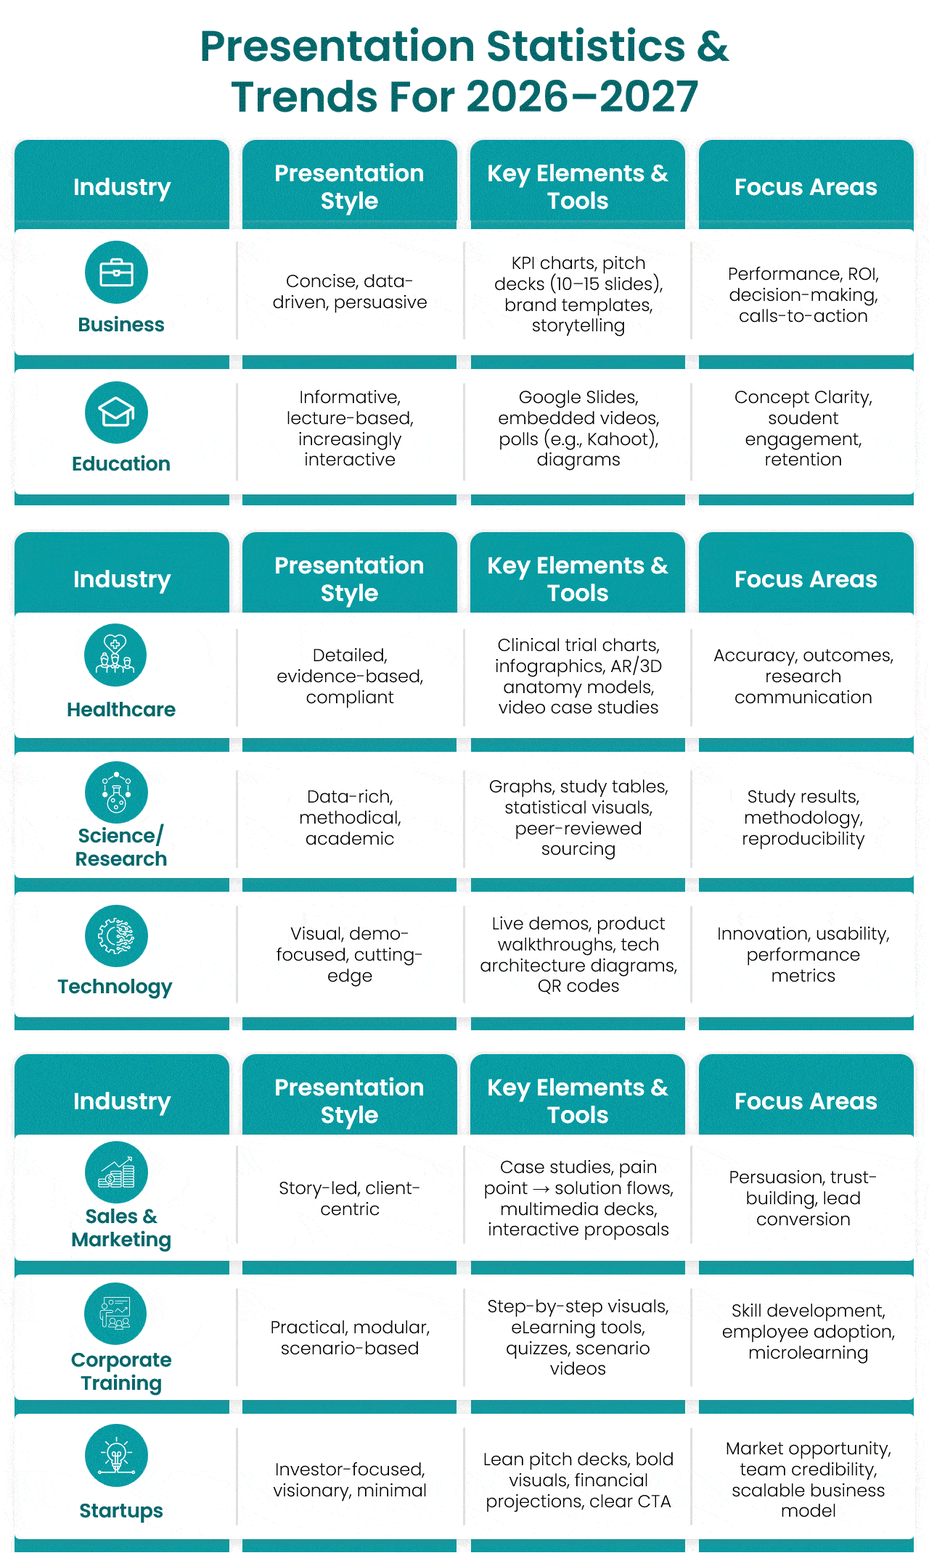
Presentation needs differ by industry, but the same pattern runs through all of them: fewer words, more visuals, and a clear decision or action at the end.
- Business: Decks are data-led and decision-focused, built around KPIs, growth plans and ROI. A quarterly business review is the classic example.
- Education: Lessons mix videos, polls and quizzes to keep students involved. See how to create an academic presentation.
- Healthcare: Content is evidence-based. Charts, graphs and patient outcome data make complex findings clear to colleagues and patients.
- Technology: Decks are demo-heavy, with product showcases, architecture diagrams and specifications. See our guide to product presentations.
- Sales and marketing: Story comes first: the customer’s pain point, your solution and proof that it works. Use this sales presentation guide.
How to Use Statistics in a Presentation
A statistic only persuades if the audience understands it in a few seconds and trusts where it came from. Five rules cover most situations:
- One number per slide. Make it the largest element on the slide and put the takeaway in the headline.
- Add context. Compare it with something: last year, a benchmark or a competitor. “122%” means little without “in the 10 minutes before a meeting”.
- Chart trends and comparisons. Use a bar or line chart when the point is change or difference. Our guides to types of charts and making a graph in PowerPoint walk you through it.
- Show the source and year on the slide. A short footnote is enough. Here is how to add footnotes in PowerPoint.
- Check that it is real and current. Trace the number to its original source before you use it. The “8-second attention span” is a good example of a statistic that spread without evidence.
For more ideas, see how to present data in the best way and 6 ways to tell a story with data. Ready-made layouts are in our Facts and Statistics template, the Business Facts Statistics Infographic and the full set of statistics PowerPoint templates.
Conclusion
The data heading into 2027 is consistent. Attention is fragmented, visuals and stories make information stick, and AI is now part of how most presenters build decks, even if they don’t yet trust it with the argument. Keep presentations short and focused, give every number a source and a story, and let AI and well-designed templates handle the formatting. Download the three templates in this article to present these statistics in your next deck.
Optional closing link: For the final slide itself, see these ways to end a presentation.
Sources
- Gloria Mark, interview on attention spans, Speaking of Psychology podcast, American Psychological Association (2023): apa.org
- BBC, “Busting the attention span myth” (2017): bbc.com
- Guy Kawasaki, “The 10/20/30 Rule of PowerPoint”: guykawasaki.com
- Decktopus, “Presentation Trends for 2020 in Numbers” (December 2020, 300+ respondents): medium.com
- Decktopus, “Top Presentation Statistics for 2026: The State of Presentations” (July 2026, 100+ respondents): decktopus.com
- Microsoft WorkLab, “Breaking down the infinite workday”, Work Trend Index (2025): microsoft.com
- John Medina, Brain Rules, Rule #10 (Vision): brainrules.net
- Vogel, Dickson & Lehman, University of Minnesota / 3M study on visual presentation support (1986): aisel.aisnet.org
- Venngage, presentation design statistics survey (2018): venngage.com
- Storydoc, “Sales and Marketing Presentations Statistics” (1.3M+ reading sessions; updated 2026): storydoc.com
- Stanford Women’s Leadership Innovation Lab, “Harnessing the Power of Stories”: stanford.edu
- Acuity Training / Censuswide, PowerPoint statistics (2023 survey): acuitytraining.co.uk
- SiliconANGLE, Gamma raises $68M at $2.1B valuation (November 2025): siliconangle.com
- TechCrunch, Canva gets to $4B in revenue (February 2026): techcrunch.com
- McKinsey, “The state of AI in 2025: Agents, innovation, and transformation” (November 2025): mckinsey.com
- Microsoft, “Copilot’s agentic capabilities in Word, Excel, and PowerPoint are generally available” (April 2026): microsoft.com
- Google Workspace, “Reimagining content creation with Gemini in Google Docs, Sheets, Slides, and Drive” (March 2026): workspace.google.com
- Google, “8 ways to make the most out of Slide Decks in NotebookLM” (December 2025): blog.google
- Google Workspace Updates, “Introducing Nano Banana Pro in Slides, Vids, Gemini app, and NotebookLM” (November 2025): googleblog.com
- Google Workspace, August 2026 feature drop: workspace.google.com
- DocSend (Dropbox), pitch deck research (updated April 2025): dropbox.com
FAQs
-
What is the average attention span during a presentation?
There is no single reliable figure for attention during a talk. The best-documented research, by Dr. Gloria Mark of UC Irvine, found that attention on a single screen lasts about 47 seconds on average before people switch. In surveys, most audiences say they can stay focused on a presentation for 10–15 minutes, so plan a change of pace at least that often.
-
Is the 8-second attention span statistic true?
No. The “8-second attention span” figure traces back to a 2015 Microsoft Canada marketing report that cited a secondary website, and a BBC investigation found no evidence that human attention spans had shrunk to eight seconds. Use Gloria Mark’s 47-second figure for screen attention instead, and describe it accurately.
-
How long should a presentation be?
For most business and classroom settings, 10 to 20 minutes works best. Most audiences say they can stay focused for 10–15 minutes, and Guy Kawasaki’s 10/20/30 rule recommends no more than 20 minutes and 10 slides for a pitch. For longer sessions, break the content into 10–15-minute blocks with a question, demo or activity in between.
-
How many people use PowerPoint?
We could not find a current official PowerPoint user count from Microsoft. A 2023 Censuswide survey for Acuity Training found that 20.3 million people aged 16+ in the UK (37.15%) have used PowerPoint, making it the most-used presentation tool there. AI-first tools are growing fast: Gamma reported about 70 million users in November 2025.
-
How are people using AI to make presentations in 2026?
In a 2026 Decktopus survey, 75.6% of respondents used AI tools in their presentation workflow, and half used AI every time or most of the time. They trust AI more for design than for strategy. Microsoft Copilot in PowerPoint and Gemini in Google Slides can now draft, update and redesign slides inside the deck.
-
How do you keep your audience engaged?
Lead with your main point, use one visual per idea, and attach a short story to each key number, since stories are up to 22 times more memorable than facts alone. Add interaction such as polls, quizzes or Q&A every 10–15 minutes. Interactive decks are read to the end 41% more often than static ones.
-
Is it better to use graphs or words in a presentation?
Use both, but let the graph carry the number. People remember about 10% of information they hear three days later, and about 65% when a picture is added (John Medina, Brain Rules). Put the takeaway in the slide headline and let the chart prove it.
-
How do I cite statistics in a presentation?
Add a short source line under the chart or number with the organization and year, for example “Source: Microsoft Work Trend Index, 2025”. Trace each figure to its original source rather than a roundup article, prefer data from the last two to three years, and say how old the data is when you use an older classic study.
Table Of Content


Related posts from the same category

14 Aug, 2026 | SlideUpLift
SlideUpLift Launches Creatos AI, the AI Presentation Maker That Never Starts From a Blank Page
Free to try, with 40,000+ professionally designed slides, AI-assisted editing, one-click branding and a fully editable PowerPoint at the end JERSEY CITY, N.J. - Aug. 14, 2026 : SlideUpLift, a

14 Aug, 2026 | SlideUpLift
How to Create an Impactful Career Presentation
Quick Answer: A strong career presentation has three parts: a short intro that states who you are and where you're headed, 3–5 milestones told as brief stories (not a list
3 Aug, 2026 | SlideUpLift
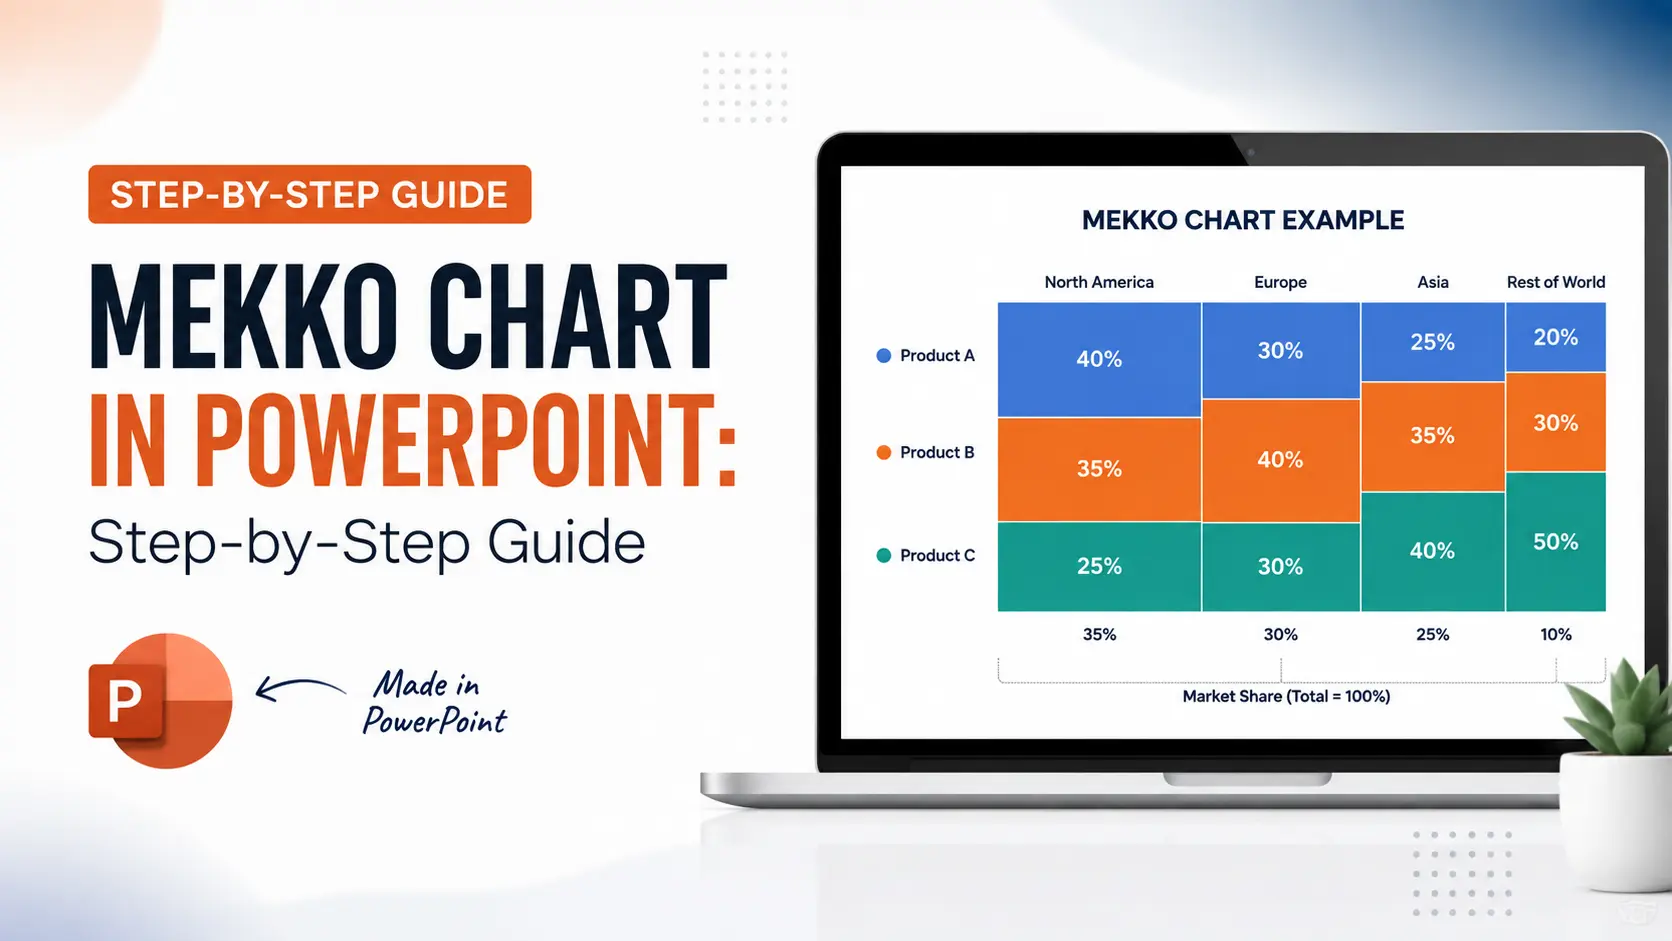
Mekko Chart in PowerPoint: Step-by-Step Guide (2026)
A mekko chart (or marimekko chart) uses variable column widths to show the size of each category, and stacked segments inside each column to show its internal split. PowerPoint has

30 Jul, 2026 | SlideUpLift
The Ultimate Guide to Types of Charts and Their Uses
Quick Answer: There are many types of charts to choose from, and there is no single "best" one — the right choice depends on what you want your data to
16 Jul, 2026 | SlideUpLift
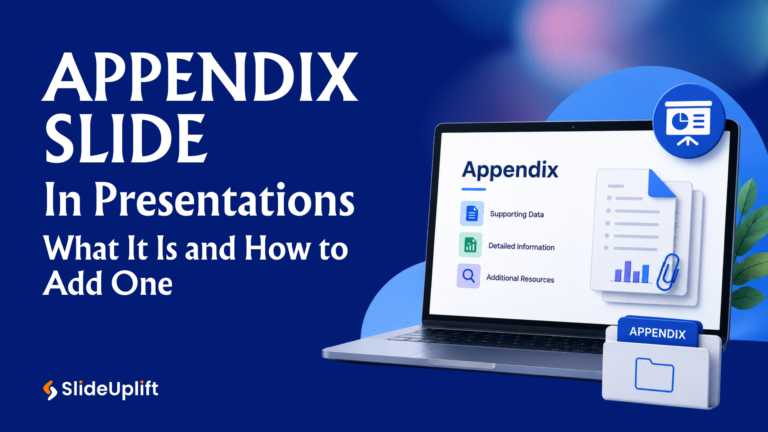
Appendix Slide in Presentations: What It Is and How to Add One
Appendix Slides: Additional data & Q&A for deeper insights An appendix slide is a supporting slide placed at the end of a presentation, after the closing slide, that holds supplementary

6 Jul, 2026 | SlideUpLift
Mastering Masking Images in PowerPoint: Step-by-Step Guide
Quick Answer Masking images in PowerPoint means displaying a picture only within a chosen shape — such as a circle, custom outline, or block of text — instead of a
15 Jun, 2026 | SlideUpLift
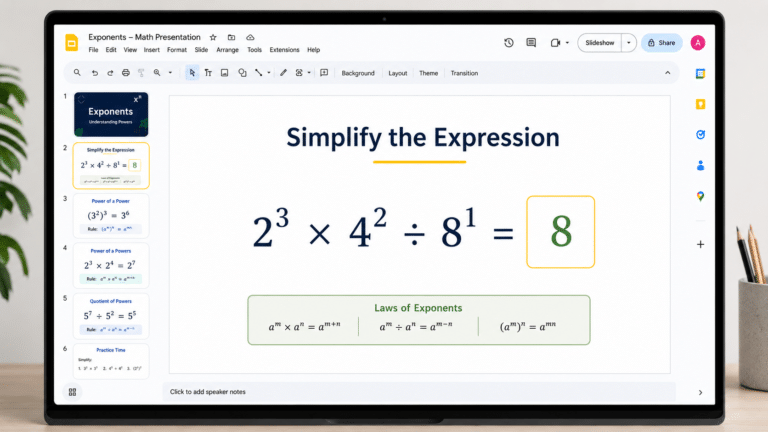
How to Add Exponents in Google Slides (3 Methods)
Quick Answer: To add an exponent in Google Slides: Click inside a text box and type your full equation (e.g., x2). Highlight only the character to raise (e.g., the '2').

3 Jun, 2026 | SlideUpLift
How to PowerPoint Shuffle Slides: 3 Easy Methods
Quick Answer PowerPoint has no built-in shuffle button, but you can randomize PowerPoint slides in three ways: Drag and drop in Slide Sorter view — fastest for small decks (under

26 May, 2026 | SlideUpLift
Claude for PowerPoint: A Comprehensive Guide for Users
Quick Answer Claude for PowerPoint is an official AI add-in by Anthropic, installed from the Microsoft Marketplace (AppSource). Once added, it embeds a sidebar directly in PowerPoint — on the

30 Apr, 2026 | SlideUpLift
How to Add a Border in Google Slides (7 Easy Methods)
To add a border in Google Slides, insert a rectangle shape, set its fill to transparent, and customize the border color and weight from the toolbar. You can apply borders

28 Apr, 2026 | SlideUpLift
How to Insert a PDF into Google Slides Every Method That Actually Works
No, Google Slides does not let you insert a PDF directly as an editable PDF object. Instead, you can use one of three practical workarounds. First, convert the PDF pages
24 Apr, 2026 | SlideUpLift
How to Insert a Check Mark in PowerPoint (PPT): 6 Methods
The fastest way to insert a check mark in PowerPoint is to copy and paste this symbol directly: ✓. If you want to insert it from PowerPoint, go to Insert

22 Apr, 2026 | SlideUpLift
How to make a Venn Diagram on Google Slides (3 Easy Methods)
Need to compare two products, contrast competing ideas, or map shared traits for a classroom exercise? The most common question designers and educators ask is how to make a Venn

21 Apr, 2026 | SlideUpLift
How To Lock An Image In Google Slides: Complete Step-By-Step Guide
If you have ever carefully positioned a logo or background graphic in Google Slides — only for an accidental click to send it flying across the slide — you are

15 Apr, 2026 | SlideUpLift
How To Change Opacity in Google Slides (Images, Shapes & Backgrounds)
In Google Slides, images and shapes use different controls for opacity. To change the opacity of an image, select it, open Format options, and adjust the Opacity or Transparency control

14 Apr, 2026 | SlideUpLift
How to Add a Video to Google Slides Step by Step (2026)
Embedding a video in your presentation takes just a few clicks through the Insert menu — but getting it to actually play for your audience requires knowing a few rules

13 Apr, 2026 | SlideUpLift
How To Lock An Image In PowerPoint: Complete Step-By-Step Guide
If you have ever spent time positioning a logo or background graphic perfectly — only for an accidental click to send it flying across the slide — this guide is

8 Apr, 2026 | SlideUpLift
How to Embed YouTube Video in PowerPoint (2026 Complete Guide)
Most PowerPoint videos fail at the worst moment — they don’t play, lag during playback, or force you to switch tabs mid-presentation. This guide shows you exactly how to embed
6 Apr, 2026 | SlideUpLift
How to Make an Interactive Quiz in PowerPoint (No Add-ins Required)
Quick Answer You can build a fully interactive quiz in PowerPoint using only the built-in Action and Hyperlink features — no add-ins or plugins required. Create three slide types (question,

1 Apr, 2026 | SlideUpLift
How to Print Google Slides with Notes: Step-by-Step Guide
Knowing how to print Google Slides with notes gives presenters and audiences a richer, more complete version of any presentation — each printed page shows the slide in the upper

30 Mar, 2026 | SlideUpLift
How to Convert PPT to Video: Complete Guide for 2026
This guide shows how to convert PPT to video using PowerPoint and other tools with simple, step-by-step methods. It covers formats, quality settings, narration, animations, and fixes for common export

26 Mar, 2026 | SlideUpLift
How to Curve Text in Google Slides (5 Methods That Actually Work)
This guide explains how to curve text in Google Slides using simple workarounds like Word Art, text rotation, and external tools, since there’s no built-in feature for curved text. It

24 Mar, 2026 | SlideUpLift
How to Wrap Text in Google Slides — 4 Methods That Actually Work
Learn how to wrap text in Google Slides with simple step-by-step methods to align text around images and create clean, professional layouts. This guide explains practical workarounds since Google Slides

20 Mar, 2026 | SlideUpLift
How to Add Annotations in PowerPoint: The Complete Step-by-Step Guide
This blog explains how to add real-time annotations in PowerPoint presentations using tools like the pen, highlighter, and laser pointer to make slides more interactive and engaging. It provides step-by-step

17 Mar, 2026 | SlideUpLift
How to Create a Project Presentation That Gets Stakeholder Approval
In any business environment, the ability to create a project presentation that actually moves people — securing approvals, aligning teams, and building client confidence — is one of the most
16 Mar, 2026 | SlideUpLift
How to Convert PowerPoint to Google Slides?
This blog explains how to convert PowerPoint to Google Slides using simple step-by-step methods like uploading PPT files to Google Drive or importing them directly into Slides. It helps users

13 Mar, 2026 | SlideUpLift
How to Play Video in PowerPoint Across Single and Multiple Slides
This blog explains how to play a single video across multiple slides in PowerPoint using simple animation and playback settings. It walks through the step-by-step process of inserting the video,

11 Mar, 2026 | SlideUpLift
How to Hide a Slide in Google Slides: Complete Guide
Learn how to hide and unhide slides in Google Slides without deleting them in this step-by-step guide. The blog explains simple methods like using the Skip Slide option, toolbar, and

9 Mar, 2026 | SlideUpLift
How to Hide and Unhide Slides in PowerPoint (Complete Guide)
This blog explains how to hide and unhide slides in Microsoft PowerPoint so you can skip certain slides during a presentation without deleting them. It covers why the hide slide
5 Mar, 2026 | SlideUpLift
Quarterly Business Review (QBR): What It Is, Examples & How to Present One
A QBR, or quarterly business review, is a strategic meeting held every three months to evaluate business performance, review key metrics, and align on goals for the next quarter. QBRs

4 Mar, 2026 | SlideUpLift
What Is a Product Roadmap? A Complete Guide With Types, Examples, and Templates
A product roadmap is a high-level strategic document that communicates a product’s vision, direction, priorities, and planned progress over time. It shows the product team and stakeholders what is being
27 Feb, 2026 | SlideUpLift
How To Broadcast a PowerPoint Presentation Online [6 Working Methods]
If you have been looking for a way to broadcast a PowerPoint presentation online to a remote audience, you have probably run into tutorials that tell you to click Slide
27 Feb, 2026 | SlideUpLift
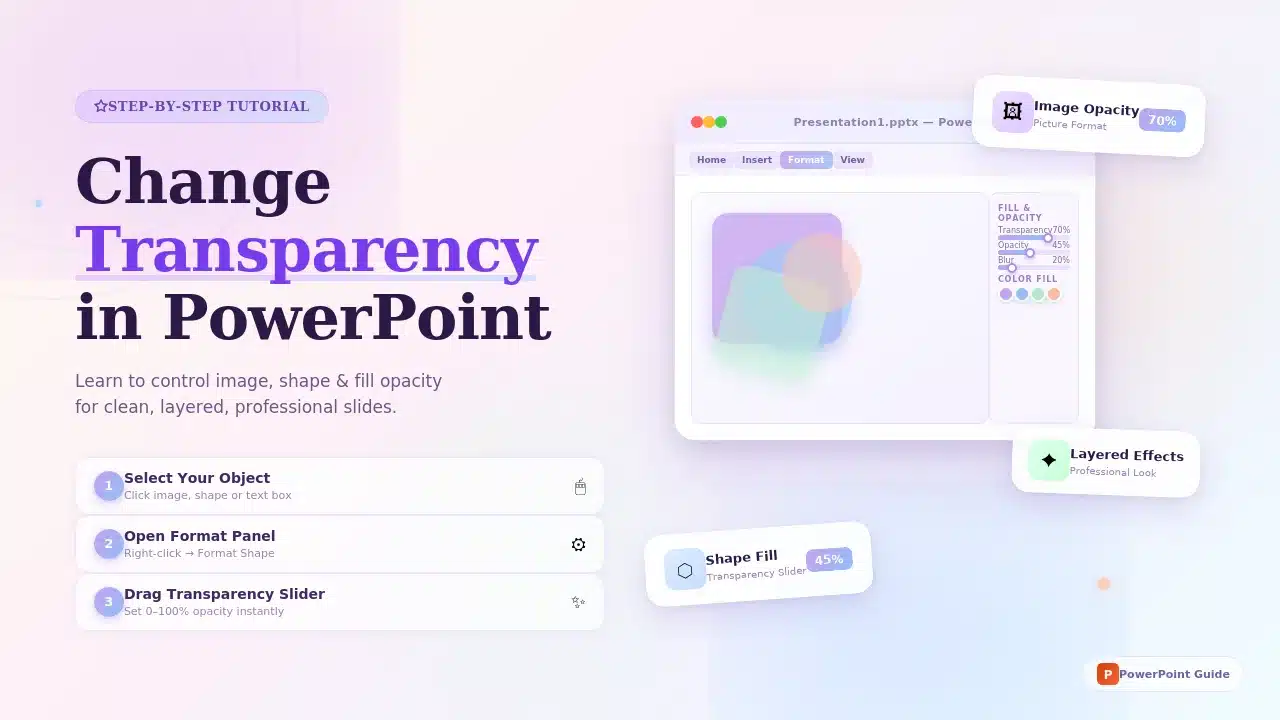
How to Change Transparency in PowerPoint (Step-by-Step Guide)
Learn how to use transparency in Microsoft PowerPoint to adjust the opacity of images, shapes, and text for cleaner, more professional slide designs. This step-by-step guide explains how to change

24 Feb, 2026 | SlideUpLift
Which Program Is Used to Open PPTX Files: Complete Guide
This blog explains which program is used to open PPTX files and how to view or edit presentations on Windows, Mac, and mobile devices. It covers tools like Microsoft PowerPoint,
20 Feb, 2026 | SlideUpLift
How to Create Engaging Academic Presentations: 10 Expert Tips + Templates
This blog is a complete guide on how to create engaging academic presentations, offering 10 expert tips for structuring content, designing slides, and delivering with confidence. It covers common mistakes

20 Feb, 2026 | SlideUpLift
How to Make Google Slides Play Automatically On A Loop? (Step-by-Step Guide)
There are two main ways to make Google Slides play automatically on a loop, and the right method depends on how you are showing the presentation. For a live presentation,
18 Feb, 2026 | SlideUpLift
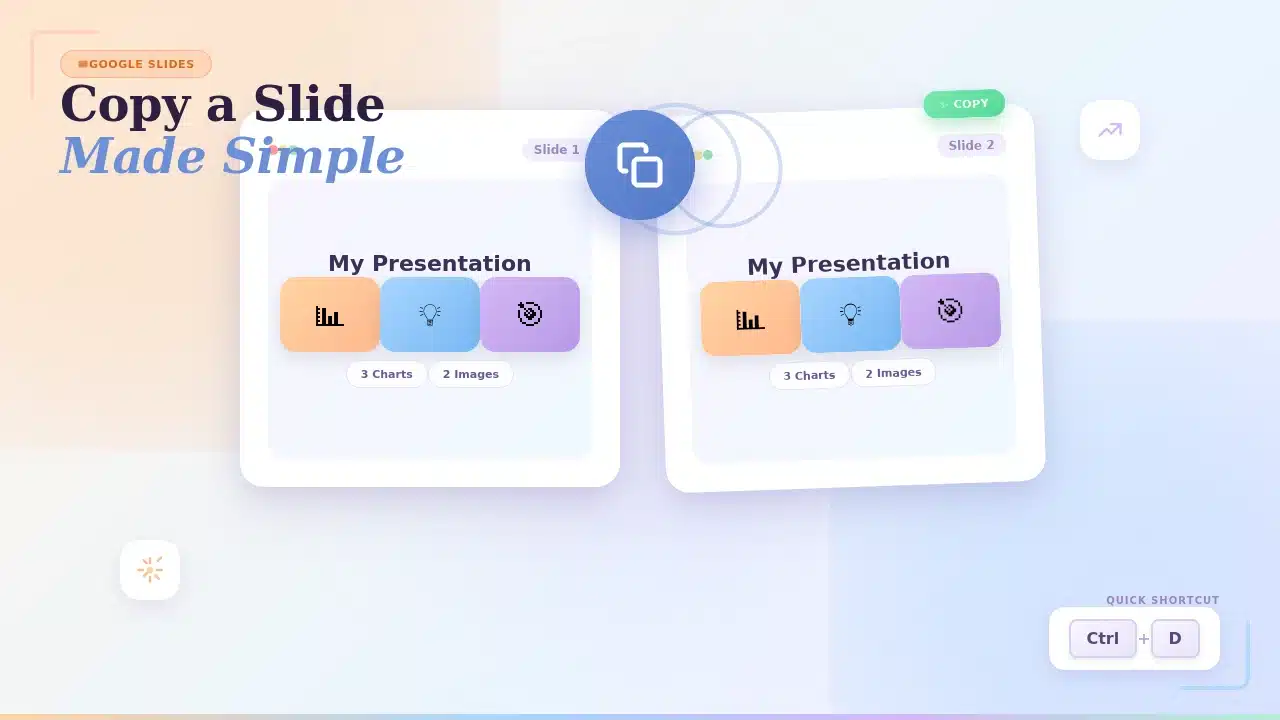
How to Copy a Slide in Google Slides: Step-by-Step Guide
Learn how to duplicate, copy, and paste a slide in Google Slides using simple, step-by-step methods. This guide covers desktop shortcuts, right-click options, toolbar methods, and mobile steps for Android
17 Feb, 2026 | SlideUpLift
How to Round Corners in Google Slides: Complete Guide
Learn how to round corners in Google Slides using both the simple yellow handle method and the advanced Edit Points feature. This guide explains how to adjust the corner radius,
12 Feb, 2026 | SlideUpLift
How To Add plus or minus symbol in PowerPoint Presentations – Step-by-Step Guide
This blog explains how to add the plus or minus symbol (±) in Microsoft PowerPoint using keyboard shortcuts (Windows & Mac), the Symbols menu, equation tools, and copy-paste methods. It
10 Feb, 2026 | SlideUpLift
How To Convert Google Slides Into PDF: Quick & Easy Guide
This guide explains how to convert Google Slides into a PDF quickly and without formatting issues. It covers saving slides with or without speaker notes and methods for desktop and

6 Feb, 2026 | SlideUpLift
How To Make A Professional PowerPoint Presentation With Practical Tips
This blog shows how to make professional presentations with clear structure, engaging visuals, and effective delivery. It highlights using AI tools like ChatGPT and Copilot with ready-made templates to quickly

4 Feb, 2026 | SlideUpLift
How to Write a Sales Pitch That Captures Attention and Converts Leads
This SlideUpLift guide explains how to write an effective sales pitch by identifying your target audience, highlighting your unique value, focusing on benefits over features, and structuring a persuasive presentation

30 Jan, 2026 | SlideUpLift
Sales Presentation: A Complete Guide to Structure, Examples, and Best Practices
This blog is a complete guide to building a high-impact sales presentation, covering everything from structure and slide selection to delivery and follow-up. It explains what makes sales presentations effective,
28 Jan, 2026 | SlideUpLift
Types of Slides That Make Presentations Clear, Engaging, and Impactful
This blog explains why choosing the right slide types is essential for clear, engaging presentations. It covers the most important PowerPoint slide types, when to use them, and how they
23 Jan, 2026 | SlideUpLift
How to Rotate a Slide in PowerPoint: Complete Guide
This blog explains how to rotate slides in PowerPoint using all practical methods, including changing slide orientation, rotating objects, and handling single-slide workarounds. It also covers professional solutions for mixing
21 Jan, 2026 | SlideUpLift
What Is 6×6 Rule in PowerPoint? Complete Guide To Improve Slides
This blog explains what is 6x6 Rule in PowerPoint and how it improves slide clarity and readability. It shows how to apply the rule, avoid common mistakes, and compare it
19 Jan, 2026 | SlideUpLift
How to Add Footnotes in PowerPoint: A Step-by-Step Guide
Adding footnotes in PowerPoint helps you cite sources and add context without overcrowding your slides. Since PowerPoint doesn’t offer an automatic footnote feature, footnotes are created manually using text boxes
16 Jan, 2026 | SlideUpLift
How To Merge PowerPoint Presentations Using Simple Methods and a Free Tool
Learn how to merge PowerPoint presentations quickly and easily using manual methods or a free merge PPT tool. Keep slides, formatting, animations, and transitions intact while creating polished, professional decks.

14 Jan, 2026 | SlideUpLift
McKinsey Slide Deck Guide: Presentation Style, Real Examples and Templates (2026)
The McKinsey presentation style is a structured, minimalist approach designed to help executives understand the main conclusion quickly. A typical McKinsey-style deck uses one clear idea per slide, an answer-first

14 Jan, 2026 | SlideUpLift
How to Add a Timer to Google Slides: Step-by-Step Guide
This blog walks you through how to add a timer to Google Slides using simple, practical methods that actually work. It covers Auto-play timing, visible countdown timers, videos, and add-ons,

8 Jan, 2026 | SlideUpLift
How to Prepare for a Presentation: A Simple Guide for Beginners
This blog explains how to prepare for a presentation step by step. It covers goal setting, content structuring, slide design, practice, and handling questions. Beginners can also learn common challenges,

6 Jan, 2026 | SlideUpLift
Presentation Tips for Structuring Messages and Effective Storytelling
This blog breaks down practical presentation tips to help you plan, design, and deliver slides that truly stand out. It covers how to simplify text, use visuals effectively, and maintain

12 Dec, 2025 | SlideUpLift
18 Best Google Slides Themes for Business & Corporate Presentations (2026)
The best Google Slides themes for business are editable, professionally designed decks built around a specific presentation job - a proposal, a QBR, a strategy roadmap, or an investor update.

9 Dec, 2025 | SlideUpLift
How to Change a PowerPoint Template – Quick Step-by-Step Guide
To change a PowerPoint template without rebuilding your presentation, open the Design tab, click the More arrow in the Themes group, choose Browse for Themes, and select the saved theme

4 Dec, 2025 | SlideUpLift
The 5-5-5-Rule-of-PowerPoint: Your Guide to Effective Design
The 5-5-5 rule of PowerPoint is a simple guideline for keeping presentation slides readable: use no more than 5 words per line, 5 lines of text per slide, and avoid
12 Nov, 2025 | SlideUpLift
How to Create a Heat Map in PowerPoint: Beginner-Friendly Guide
Heat maps are one of the easiest ways to turn rows of numbers into visuals people understand quickly. In this blog, you will learn what a heat map is, in

6 Nov, 2025 | SlideUpLift
How to Add Transitions in PowerPoint: Complete Step-by-Step Guide
Do you want to create a seamless flow in your PowerPoint slides and make a strong impression? While adding transitions to PowerPoint slides might seem obvious, transitions are the key

4 Nov, 2025 | SlideUpLift
How to Use Morph in PowerPoint: The Ultimate Guide to Smooth Transitions
If you’ve ever watched a presentation where shapes flow smoothly, images glide effortlessly, and text elegantly shifts between slides, you’ve witnessed the power of Morph in PowerPoint. This feature is
30 Oct, 2025 | SlideUpLift
How To Make A Graph In PowerPoint: Step-by-Step Guide
The goal of impactful graphs is not simply to convey data; rather, it is to tell a story with data that has meaning to the audience. Graphs and charts can

13 Oct, 2025 | SlideUpLift
How to Write a Business Case: A Beginner’s Guide + Examples
Every project needs a passport to get through executive approval. Without it, even the best plans can get grounded before taking off. This very piece of evidence holds the power

10 Oct, 2025 | SlideUpLift
What Is A Project Charter? Definition, Examples & Best Practices
Launching a project without adequate planning can result in confusion, delays, and misaligned expectations. A project charter is a key document in the project documentation process that lays the groundwork

8 Oct, 2025 | SlideUpLift
How to Insert Emoji in Google Slides & PowerPoint for Fun, Eye-Catching Slides
Have you ever thought about how a simple emoji can change the mood or tone of your presentation? You could use a smiley face 😊, that would certainly lighten the
1 Oct, 2025 | SlideUpLift
Insert Calendar In PowerPoint And Google Slides: Quick Guide For Smarter Planning.
Do you want your presentations to be more organized, attractive, and professional? Learning how to add a calendar in PowerPoint or Google Slides will take boring schedules and deadlines and
26 Sep, 2025 | SlideUpLift
What Is a PPTX File? Think of It as PowerPoint 2.0
A .pptx file is Microsoft PowerPoint's Open XML presentation format, introduced with PowerPoint 2007 as the successor to the older binary .ppt format. It can contain slides, text, images, charts,

17 Sep, 2025 | SlideUpLift
Google Slides Strikethrough: Cross Out The Old And Spotlight The New
Ever wished you could just cross something out instead of deleting it? You know, like putting a big line through “boring idea” and replacing it with “brilliant plan”. That’s the
12 Sep, 2025 | SlideUpLift
What is KPI? Step-by-Step Guide with KPIs Examples That Work
Is it hard for you to know if your business is getting to the level it should be? That's where key performance indicators (KPIs) come into play. KPIs indicate how

10 Sep, 2025 | SlideUpLift
Best Fonts For PowerPoint Presentation: The Runway Of Letters
Imagine this: your presentation is a red-carpet event. Your slides are the guests, the content is the message, and the font? That is the outfit; the one builds up the

10 Sep, 2025 | SlideUpLift
Advantages and Disadvantages of Microsoft PowerPoint: Pros, Cons, and AI Features Explained
PowerPoint has been the go-to tool for presentations for decades—but is it keeping up with today’s fast-paced, AI-driven world? PowerPoint makes it easy to take ideas to slides, whether you're

5 Sep, 2025 | SlideUpLift
10 Virtual Meeting Etiquette Rules for Professionals
Introduction Virtual meetings and online meetings are the new normal for remote work teams everywhere. Whether you're chatting with co-workers, giving a client presentation, or taking part in a hybrid

3 Sep, 2025 | SlideUpLift
How to Add Watermark in PPT Like a Pro: Step-by-Step Tutorial
Every presentation tells a story, but it should also say who it belongs to, right? And if we tell you that there is a way to stamp your identity on

29 Aug, 2025 | SlideUpLift
50 ChatGPT Prompts for Presentations (Copy-Paste Ready, Categorized for Professionals)
Most professionals don’t have a ChatGPT problem. They have a prompt problem. If you’ve ever asked ChatGPT to “make me a presentation on quarterly sales” and watched it spit out

29 Aug, 2025 | SlideUpLift
Microsoft Copilot vs ChatGPT-4 Showdown: Who’s Got the Edge?
Not long ago, making a presentation meant spending hours and hours writing content, formatting slides, finding visuals, and tweaking layouts. Tools like PowerPoint and Google Slides gave us templates, but

29 Aug, 2025 | SlideUpLift
14 Best Presentation Software Tools in 2026: In-Depth Comparison Guide
The fact is, giving a great presentation is not only about how you choose your words, but rather involves expressing those very words. With the right PowerPoint presentation software, you

28 Aug, 2025 | SlideUpLift
Password Protect PPT: How To Secure Your Presentations (Easy Guide)
Have you ever shared a PowerPoint and then worried, “What if someone changes my slides?”, or even worse, “What if the wrong person opens it and leaks the content?”. Frustrating,

26 Aug, 2025 | SlideUpLift
Track Changes In PowerPoint And Keep Your Team In Sync
Ever spent hours perfecting a PowerPoint, way too much time that you then forget to track who made what change? You aren't alone. Unfortunately, unlike Word or Gmail slides, PowerPoint
14 Aug, 2025 | SlideUpLift
Curved Arrow PowerPoint: How to Make, Draw, and Customise Arrows Step by Step
Quick Answer: To make a curved arrow in PowerPoint, go to Insert > Shapes > Block Arrows, select a curved arrow shape, and drag to draw it on your slide.

13 Aug, 2025 | SlideUpLift
How To Create Infographics In PowerPoint For Smarter Visual Storytelling?
As a professional, you might have to host meetings and deliver presentations to your stakeholders and team members. As a host, it's crucial to deliver presentations in a way that
6 Aug, 2025 | SlideUpLift
How To Edit Footer In PowerPoint For Consistent Presentation Design
Footers are an important part of a PowerPoint presentation. They give the same footer text, like the date or slide numbers, on all slides. This helps people understand the talk

31 Jul, 2025 | SlideUpLift
Google Slides vs PowerPoint: Which Is Better in 2026?
Google Slides vs PowerPoint at a Glance If you need…PickWhySeveral people editing at onceGoogle SlidesReal-time co-editing, comments and suggestions in the browser.Work with no internetPowerPointThe installed desktop app works fully

25 Jul, 2025 | SlideUpLift
How Many Slides For A 30 Minute Presentation? Timing, Tips, and Structure
One of the biggest challenges in presentations is staying on time. Whether it’s 5 minutes or 45, running over means rushing key points or losing your audience. Here’s the good

21 Jul, 2025 | SlideUpLift
PowerPoint Slide Size 101: Why It Matters More Than You Think
The default PowerPoint slide size is Widescreen (16:9), which measures 13.33 x 7.5 inches and is commonly used at 1920 x 1080 px for Full HD screens. The older Standard

15 Jul, 2025 | SlideUpLift
Google Slides Shortcuts Cheat Sheet To Boost Workflow
Google Slides is already a go-to tool for everything. From classroom projects to business decks and online workshops. It is a one-stop platform to create and share your ideas, thoughts,

7 Jul, 2025 | SlideUpLift
PowerPoint Shortcuts: The Beginner-to-Pro Keyboard Cheat Sheet
PowerPoint is one of the most powerful tools for creating presentations. However, working in PowerPoint can become time-consuming, especially when you have to click through menus for every small task.

4 Jul, 2025 | SlideUpLift
Why Your Conclusion Slide Matters—And How To Get It Right
Picture this: You've delivered an amazing presentation. Great start solid middle... but then... the ending just... flops. The energy drains. People shuffle out, already thinking about lunch. Sad, isn't it?
3 Jul, 2025 | SlideUpLift
How to Change Text Color in Google Slides for Maximum Impact – Quick Guide
Using Google Slides to build presentations is now widely practiced across the digital world. It is clean, collaborative, and performs its tasks fairly well. Be it a business pitch, a

30 Jun, 2025 | SlideUpLift
A Simple Guide On How To Change Margins In PowerPoint
Margins—those often-overlooked borders framing your slides—play a crucial role in creating polished, professional presentations. Adjusting margins helps you control your layout. This is important for printed handouts and projections. It

13 Jun, 2025 | SlideUpLift
How to Make an Org Chart in PowerPoint: Step-by-Step Guide [+ Templates]
Without a clear org chart, even small teams feel messy. People start asking: “Who’s responsible for what?” Whether you are a manager, HR professional, or team lead, explaining the team

12 Jun, 2025 | SlideUpLift
How to Make an Org Chart in Google Slides: A Step-by-Step Guide
Want to map out any type of organizational structure—whether it's a company, project team, or even a hierarchy? An org chart helps visualize relationships between roles, departments, or functions in

28 May, 2025 | SlideUpLift
Beginner’s Guide: How To Make A Venn Diagram In Powerpoint
What Is A Venn Diagram? In today’s fast-paced business world, clarity is currency, and Venn diagrams deliver just that. Whether you're analyzing market segments, comparing competitors, or aligning team strategies,

27 May, 2025 | SlideUpLift
How to Create a Roadmap Diagram in PowerPoint? (Step-by-Step Guide)
Need to build a professional roadmap slide for your next presentation? You are in the right place. This tutorial walks you through every method for creating a roadmap diagram in

14 May, 2025 | SlideUpLift
How To Crop A Picture Into A Circle In The Presentation: Step-By-Step Guide
To crop a picture into a circle in PowerPoint, select the image, go to Picture Format -> Crop -> Crop to Shape, and choose Oval. Then use a 1:1 aspect

9 May, 2025 | SlideUpLift
Mastering SVG in PowerPoint for Sharp & Professional Slides
SVG vs PNG in PowerPoint SVG in PowerPoint refers to inserting Scalable Vector Graphics — images built from mathematical paths instead of pixels — directly into your slides. Because SVGs

6 May, 2025 | SlideUpLift
VBA in PowerPoint: How to Automate Your Slides
Quick answer: VBA (Visual Basic for Applications) is the programming language built into PowerPoint. You use it to write macros that automate repetitive tasks — formatting every slide, inserting logos,

2 May, 2025 | SlideUpLift
150+ Informative Speech Topics for 2026 (Students, College & Work)
Picking the right informative speech topic is half the battle: it decides how easy your research will be, how confident you'll sound, and whether your audience leans in or checks
22 Apr, 2025 | SlideUpLift
18 Timeline Examples for Presentations (+ Free Templates)
Quick answer: A timeline is a visual that shows events in chronological order, making milestones, schedules, and progress easy to follow at a glance. Presenters use them for project plans,

28 Mar, 2025 | SlideUpLift
Can ChatGPT Make a PowerPoint Presentation? Step-by-Step Guide
Yes, ChatGPT can help you make a presentation by generating the outline, slide-by-slide content, key messages, and speaker notes. It can also produce a basic downloadable PowerPoint file through supported

2 Jan, 2025 | SlideUpLift
How to Present an Action Plan in PowerPoint: Templates, Design Tips & Examples [2026]
Why Presentation Matters You’ve created a solid action plan. Now comes the critical part: presenting it effectively to stakeholders, team members, and leadership. Here’s the reality: A brilliant action plan

2 Jan, 2025 | SlideUpLift
How to Write an Action Plan: 5-Step Guide with Examples [2026]
What Is An Action Plan? An action plan is a detailed roadmap that transforms your goals into concrete, executable steps. It’s not just a wish list—it’s a strategic document that

10 Dec, 2024 | SlideUpLift
How to Make a PowerPoint Presentation Attractive: 11 Design Techniques (2026)
Quick Answer: Making a PowerPoint attractive comes down to a set of repeatable layout techniques — visual bullets, split layouts, chunking, full-bleed images with overlays, icon systems, focal points, and

22 Nov, 2024 | SlideUpLift
Personal Timeline Examples: 15+ Ideas to Map Your Life Story
A personal timeline is a visual map of the key moments in your life — births, milestones, achievements, and turning points — arranged in chronological order. People use them for
5 Aug, 2024 | SlideUpLift
Org Chart Examples: 12 Real Examples by Type & Industry [+ Free Templates]
An organizational chart (org chart) is a diagram that shows a company's internal structure — who reports to whom, how teams are grouped, and where each role sits in the

24 Jul, 2024 | SlideUpLift
SWOT Analysis: The Complete Guide to Strengths, Weaknesses, Opportunities & Threats
One of the biggest challenges professionals face is a lack of structured thinking when strategizing plans, conducting competitor analysis, or evaluating current strategies. This often leads to wasted time, inconsistent

25 Jun, 2024 | SlideUpLift
Best PowerPoint Color Palettes for 2026 (Trends, Examples & Psychology)
The best PowerPoint color palette depends on the purpose and tone of your presentation. For corporate decks, use dependable blues, teals, whites, and neutrals to create a clear, credible look.

24 Apr, 2024 | SlideUpLift
How to Create a Project Timeline: Steps, Types & Examples
A project timeline is a visual schedule that lays out a project's phases, tasks, milestones, and deadlines in chronological order, so your team can see what is due and when.

19 Apr, 2024 | SlideUpLift
How To Make A Flow Chart In Google Slides [Step-by-Step Guide]
If you have been manually sketching process flows or copying shapes one by one, there is a faster way. Google Slides has everything you need to build a clean, professional

19 Mar, 2024 | SlideUpLift
How To Make A Flow Chart in PowerPoint Presentation?
To make a flowchart in PowerPoint, go to Insert → SmartArt → Process, select a layout, click OK, fill in your steps, and apply a color scheme under SmartArt Design.

5 Mar, 2024 | SlideUpLift
SWOT Analysis Examples: Real-World Examples for Business, Projects & Products
The fastest way to understand a SWOT analysis is to see completed ones. Below are five detailed SWOT examples — two well-known companies, a small business, a project, and a

4 Mar, 2024 | SlideUpLift
5 Whys Root Cause Analysis: How It Works (With Examples)
Quick Answer 5 Whys root cause analysis is a problem-solving technique developed at Toyota that asks “why” repeatedly (typically five times) to trace a problem from its symptoms back to

29 Feb, 2024 | SlideUpLift
How to Create Harvey Balls in PowerPoint: A Complete Step-by-Step Guide
Quick Answer: What Are Harvey Balls and How Do You Create Them? Harvey Balls are circular ideograms — partially filled circles — used to represent qualitative data such as project

20 Feb, 2024 | SlideUpLift
Start Stop Continue Retrospective: A Complete Guide With Examples, Templates & Exercises
A Start Stop Continue retrospective is a team reflection exercise where each member names one thing the team should start doing, one it should stop, and one it should continue.

9 Feb, 2024 | SlideUpLift
60+ Best Business Presentation Topics to Captivate Your Audience (2026)
Imagine standing in front of a room full of people waiting to hear what you have to say. Instead of feeling nervous, you feel confident and prepared — because you

30 Jan, 2024 | SlideUpLift
9 Box Talent Review Explained [Detailed 9 Box Matrix Guide]
Quick Answer A 9 box talent review is a talent management tool that plots employees on a 3x3 grid across two dimensions: current performance and future potential. Managers use it

24 Jan, 2024 | SlideUpLift
How to Make a Roadmap Presentation That Wins Buy-In
Quick answer: To make a roadmap presentation that lands, tailor it to your audience, build it around a narrative instead of a list of dates, present at the right level

24 Jan, 2024 | SlideUpLift
How to Make a Business Plan Presentation: Guide, Examples & Free Template
Quick Answer A business plan presentation is a concise, visual slide deck — usually 10 to 12 slides — that communicates a company's business model, market analysis, competitive position, marketing

24 Jan, 2024 | SlideUpLift
What Is a Project Roadmap? A Complete Guide With Examples and Free Templates
A project roadmap is a high-level visual plan that shows a project’s goals, major milestones, key deliverables, and timeline at a glance. Unlike a detailed project plan that tracks tasks
21 Dec, 2023 | SlideUpLift
25+ Project Management Presentation Topics for 2026
Project management presentation topics span everything it takes to deliver work successfully — planning methods, team collaboration, risk management, leadership, and the trends reshaping how projects get done. Whether you're

18 Dec, 2023 | SlideUpLift
Project Proposal Presentation: How to Make One That Gets Approved
Quick Answer: A project proposal presentation is a slide deck that pitches a project to decision-makers — investors, management, or stakeholders — to win approval, funding, or resources. It covers

20 Nov, 2023 | SlideUpLift
How to Add Superscript and Subscript in Google Slides
Quick Answer: To add a superscript in Google Slides: Click inside a text box and type your full expression (e.g., x2). Highlight only the character to raise (e.g., the 2).

18 Nov, 2023 | SlideUpLift
How to Insert Icons in Google Slides Presentations
Quick Answer There are 5 ways to insert icons in Google Slides quickly and effectively: Install the Flaticon or Noun Project add-on via Extensions > Add-ons > Get add-ons Use
12 Oct, 2023 | SlideUpLift
How to Do Hanging Indent on Google Slides: 4 Easy Methods (Complete Guide)
Have you ever tried to format citations or multi-line bullet points in Google Slides, only to end up with text that wraps messily back to the left edge? You are

13 Sep, 2023 | SlideUpLift
How to Write a Presentation: Outline, Script & Examples
Quick Answer To write a presentation, work in this order: (1) write your message as one full sentence with a verb, (2) build an outline of 3–5 main points before

28 Feb, 2023 | SlideUpLift
Gardner’s Theory of Multiple Intelligences: All 8 Types Explained
Quick Answer: Gardner's Theory of Multiple Intelligences proposes that intelligence is not one fixed ability but a set of at least eight distinct types — linguistic, logical-mathematical, spatial, bodily-kinesthetic, musical,

21 Feb, 2023 | SlideUpLift
PowerPoint Design Ideas: Layouts, Colors, Charts & the Design Ideas Feature (2026)
A great message can still fail on a bad slide. Design is what carries your idea from your head into your audience's — the color choices, the layout, the way

14 Feb, 2023 | SlideUpLift
How to Make a Presentation: A Step-by-Step Guide
Quick answer: To make a presentation, work in this order — (1) write your one-sentence takeaway before you open any software, (2) outline your slides as plain text, (3) set

13 Oct, 2022 | SlideUpLift
Agile vs Traditional Project Management: Key Differences and Which Is Better
Agile project management is an iterative, flexible approach that delivers work in short cycles and adapts to change as it goes. Traditional (Waterfall) project management is a linear, plan-driven approach

8 Sep, 2022 | SlideUpLift
How to Add Background Music in PowerPoint: The Complete Guide (All Versions)
You've spent hours building the perfect presentation — your slides are polished, your data is solid, your design is on point. But something still feels flat. That missing ingredient? Background
1 Sep, 2022 | SlideUpLift
How To Group & Ungroup In Google Slides (Step-by-Step Guide)
This blog walks you through how to group and ungroup elements in Google Slides in a simple, practical way. It covers grouping images, shapes, text boxes, and objects, along with

25 Oct, 2021 | SlideUpLift
How To Make a Quiz in Google Slides? (Step-by-Step Guide)
Quick Answer: To make a quiz in Google Slides, create a question slide with answer options, then build separate “Correct Answer” and “Wrong Answer” feedback slides. Use Insert → Link
3 Mar, 2021 | SlideUpLift
30-60-90 Day Plan for Interview: Examples, Templates & Sample Answers
A 30-60-90 day plan for an interview is a short presentation or one-page document that outlines what you will accomplish in your first 30, 60, and 90 days in the
6 Jan, 2021 | SlideUpLift
Mastering Zoom in PowerPoint: Tips for Engaging Presentations
Quick Answer 1: How to use the PowerPoint Zoom navigation feature Go to Insert tab → Links group → Zoom Choose Slide Zoom, Section Zoom, or Summary Zoom Select your
17 Feb, 2020 | SlideUpLift
PowerPoint Arrows: How to Make an Arrow Diagram in PowerPoint | Step-by-Step Tutorial
Quick Answer — How to Insert Arrow in PowerPoint To insert arrow in PowerPoint and build a diagram: Go to Insert > Shapes and select a Rectangle. Duplicate it (Ctrl+D)

4 Dec, 2019 | SlideUpLift
How to Do Hanging Indent on PowerPoint: 5 Easy Methods (Windows & Mac)
Whether you're formatting an APA reference list on a slide, polishing multi-line bullet points, or creating a clean agenda, knowing how to do a hanging indent in PowerPoint is one

25 Mar, 2019 | SlideUpLift
16 PowerPoint Hacks You Didn’t Know for More Effective Presentations
Quick Answer: The most useful PowerPoint hacks include playing a video continuously behind your content, using Sections and Summary Zoom for smooth navigation, applying Morph transitions, embedding fonts before sharing,